Market Follow Through - Market Analysis for Mar 5th, 2020
It has been quite some time since we saw bearish set ups actually follow through. And, today’s action certainly did follow through on the set up highlighted yesterday.
So, where do we stand right now?
Well, this brings me back to the IWM which has been providing us with amazing trading cues, which has also allowed to catch almost all of these major turning points of late. And, the trading has been amazing.
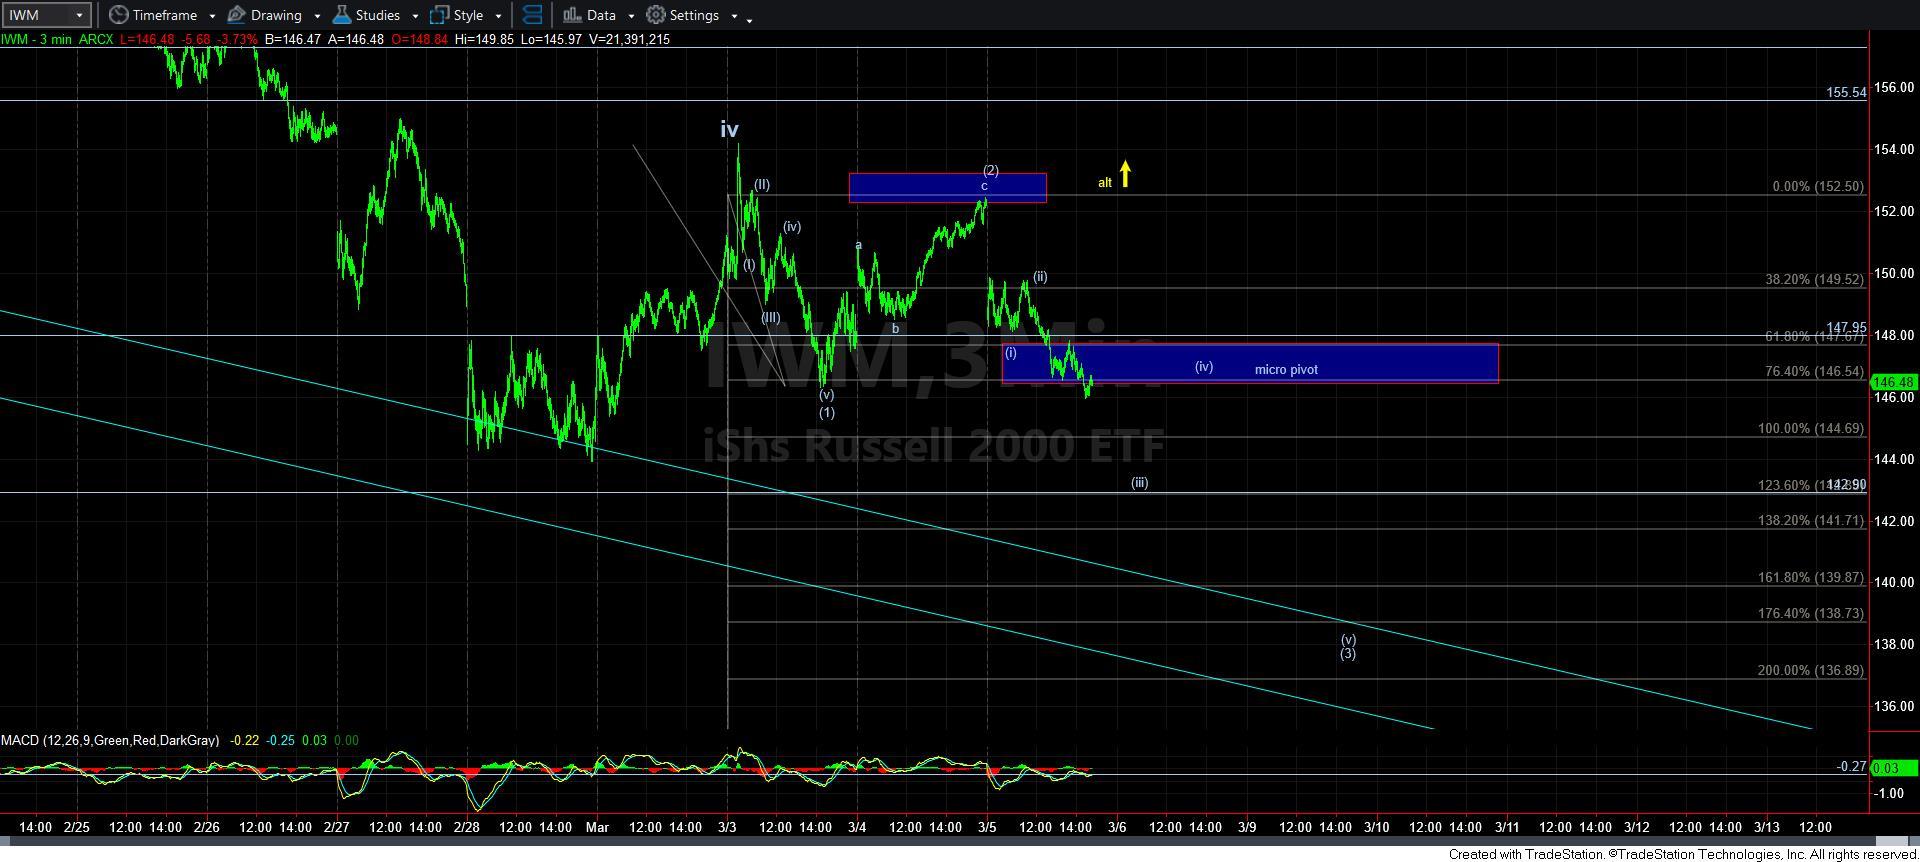
If we are going to indeed follow through on the [1][2] downside set up highlighted in yesterday’s update, then today’s action should have begun wave [3] down. The only question I have at the time of my writing this update is if we see one more corrective retracement back up towards 149-151, or if we have already begun wave [iii] of [3] notated on my 3-minute IWM chart.
The main bigger picture takeaway is that as long as we now remain below the 149-151 lowered resistance region, pressure will remain down.
Our next target point will be the 1.00 extension of waves [1] and [2] to the downside in the 144.70 region. Once we reach that region, the micro pivot I have outlined on my chart becomes our next lowered resistance point (lowered from the 149-151 region).
Basically, within our Fibonacci Pinball methodology, when the market drops down in wave [iii] of [3], the predominant target resides between the 1.00-1.236 extension of waves [1] and [2]. In our case, that is the 143-144.70 region. At that time, I would expect a wave [iv] of [3] bounce to take us back to the pivot. As long as the pivot holds and we continue lower in impulsive fashion our next downside target would be the 139-140 region for wave [v] of [3].
However, if the market moves through the 151 level from where we are at the bottom of the pivot as I write this update, that would be a strong warning that the immediate bearish pattern may take another twist or turn. Remember, we are still very much in a larger degree corrective structures, and they are as difficult as trying to throw jello for distance.
Furthermore, should we drop to the 1.00 extension in the 144.70 region, and then move back up through the pivot, that would also suggest that something else is playing out.
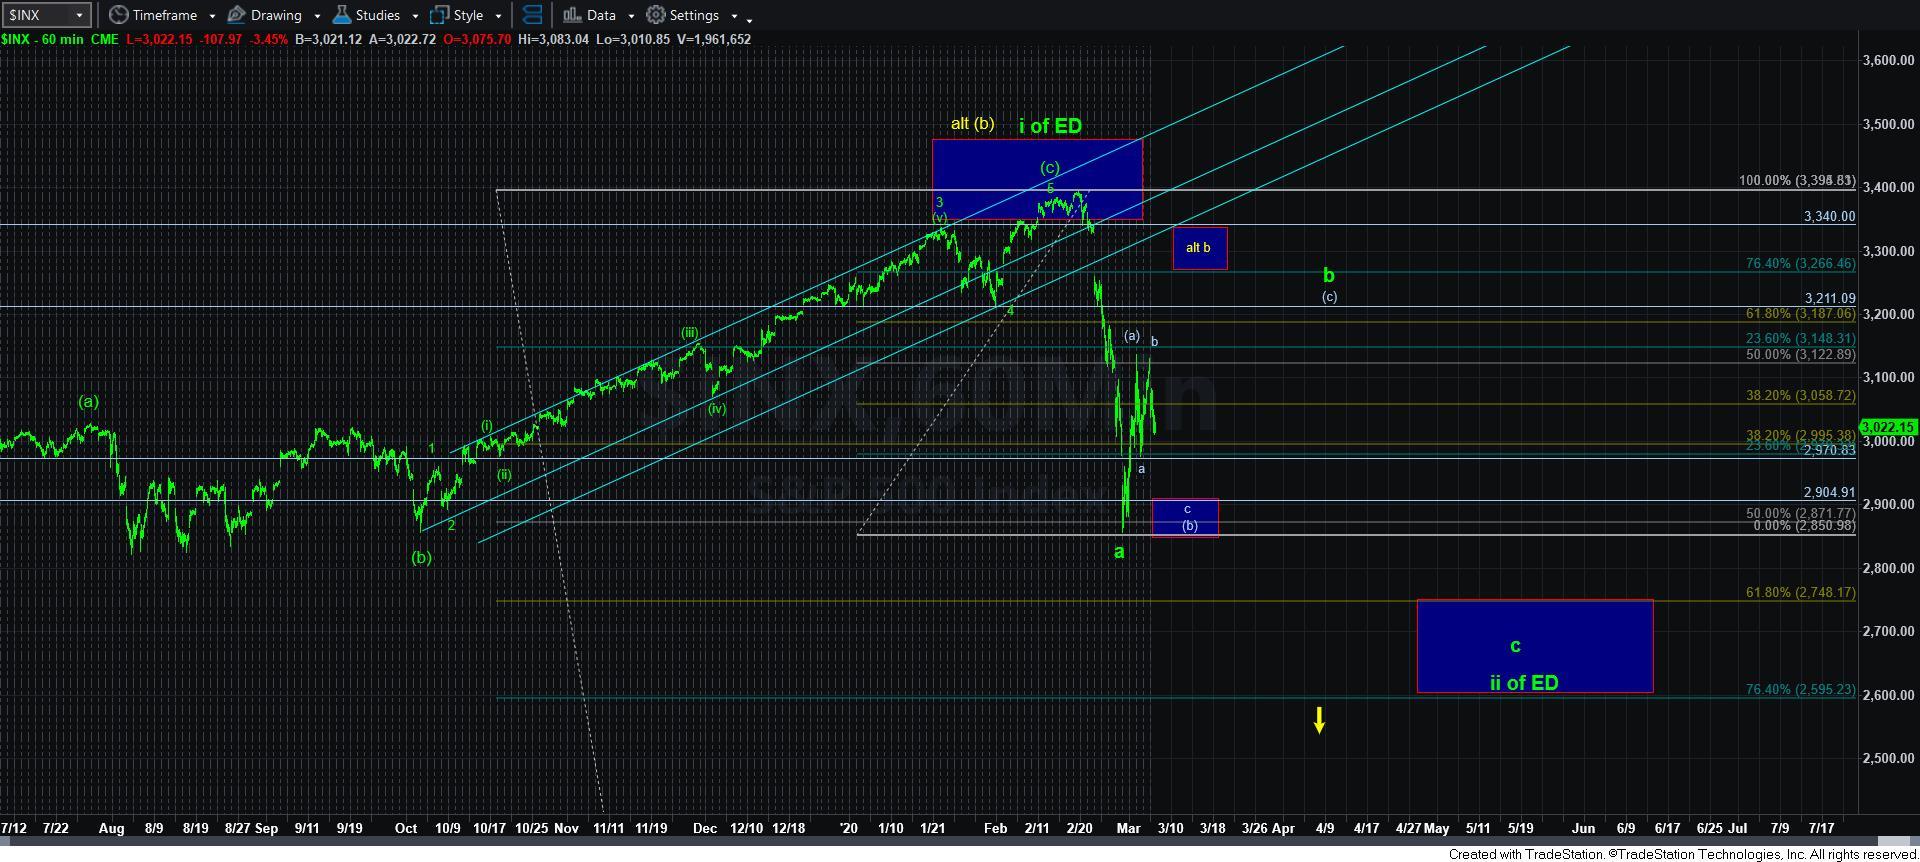
As far as the SPX is concerned, my ideal path still points down towards the lows we struck last week. However, if the IWM should break its immediate downside set up, then that would warn us that the yellow count may be beginning to increase in probability.
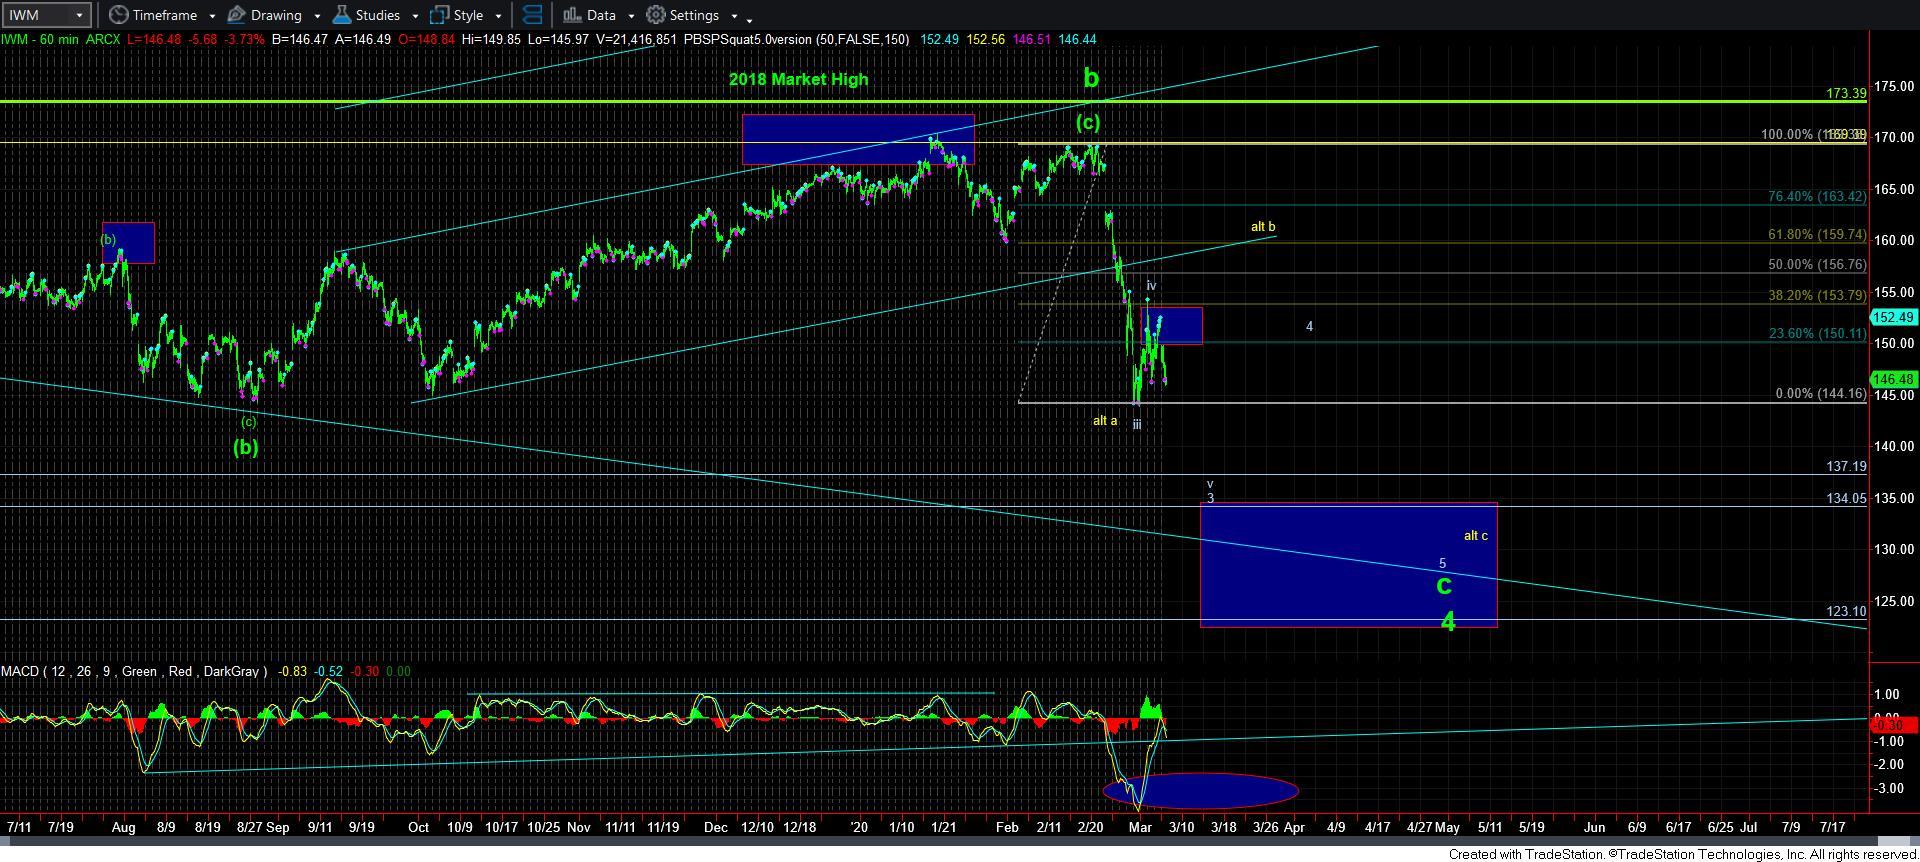
Most specifically, micro support in SPX is at 3008, to be followed by 2970. It takes a break down bellow 2970 to point us to the 2865-2900 region for the ideal target of the c-wave of [b] as outlined on the 60 minute chart.
While the market has been giving us amazing clues for these turning points we have been catching on an almost daily basis – and intra day as well – I have to warn you that I almost “feels” like we are due for a curve ball. So, please stay on your toes, and do not trade this crazy action too aggressively. You can make a lot of money in these types of swings with a small position. But, at the same time, remember we are working within a larger corrective structure, and even though I use this example often, it is like trying to throw jello for distance, since the patterns are most variable within a corrective structure.