Market Finds Support and Re-Tests The All-Time-Highs
 By
By
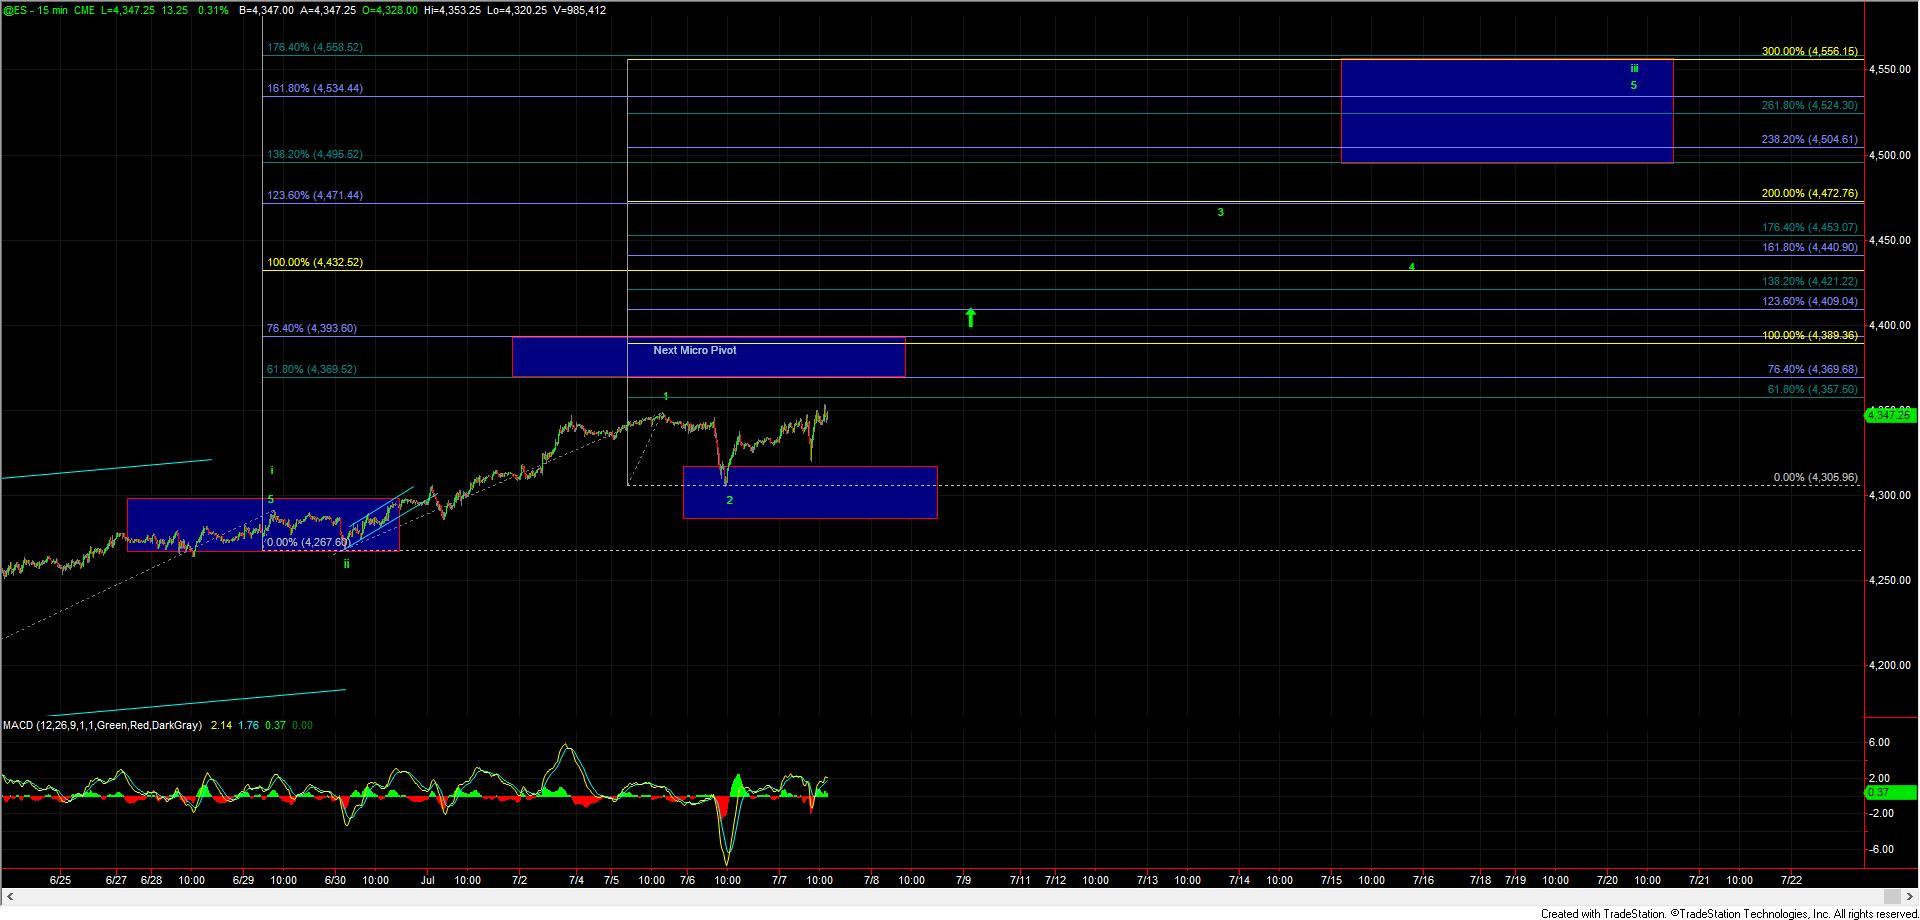
After opening higher the SPX/ES saw a small pullback during the morning session that was quickly bought during the early afternoon session and continues to be bought as we near the end of the day. We are now pressing the previous highs and are closing in on the next key overhead pivot levels which remain in the 4369-4393 zone on the ES.
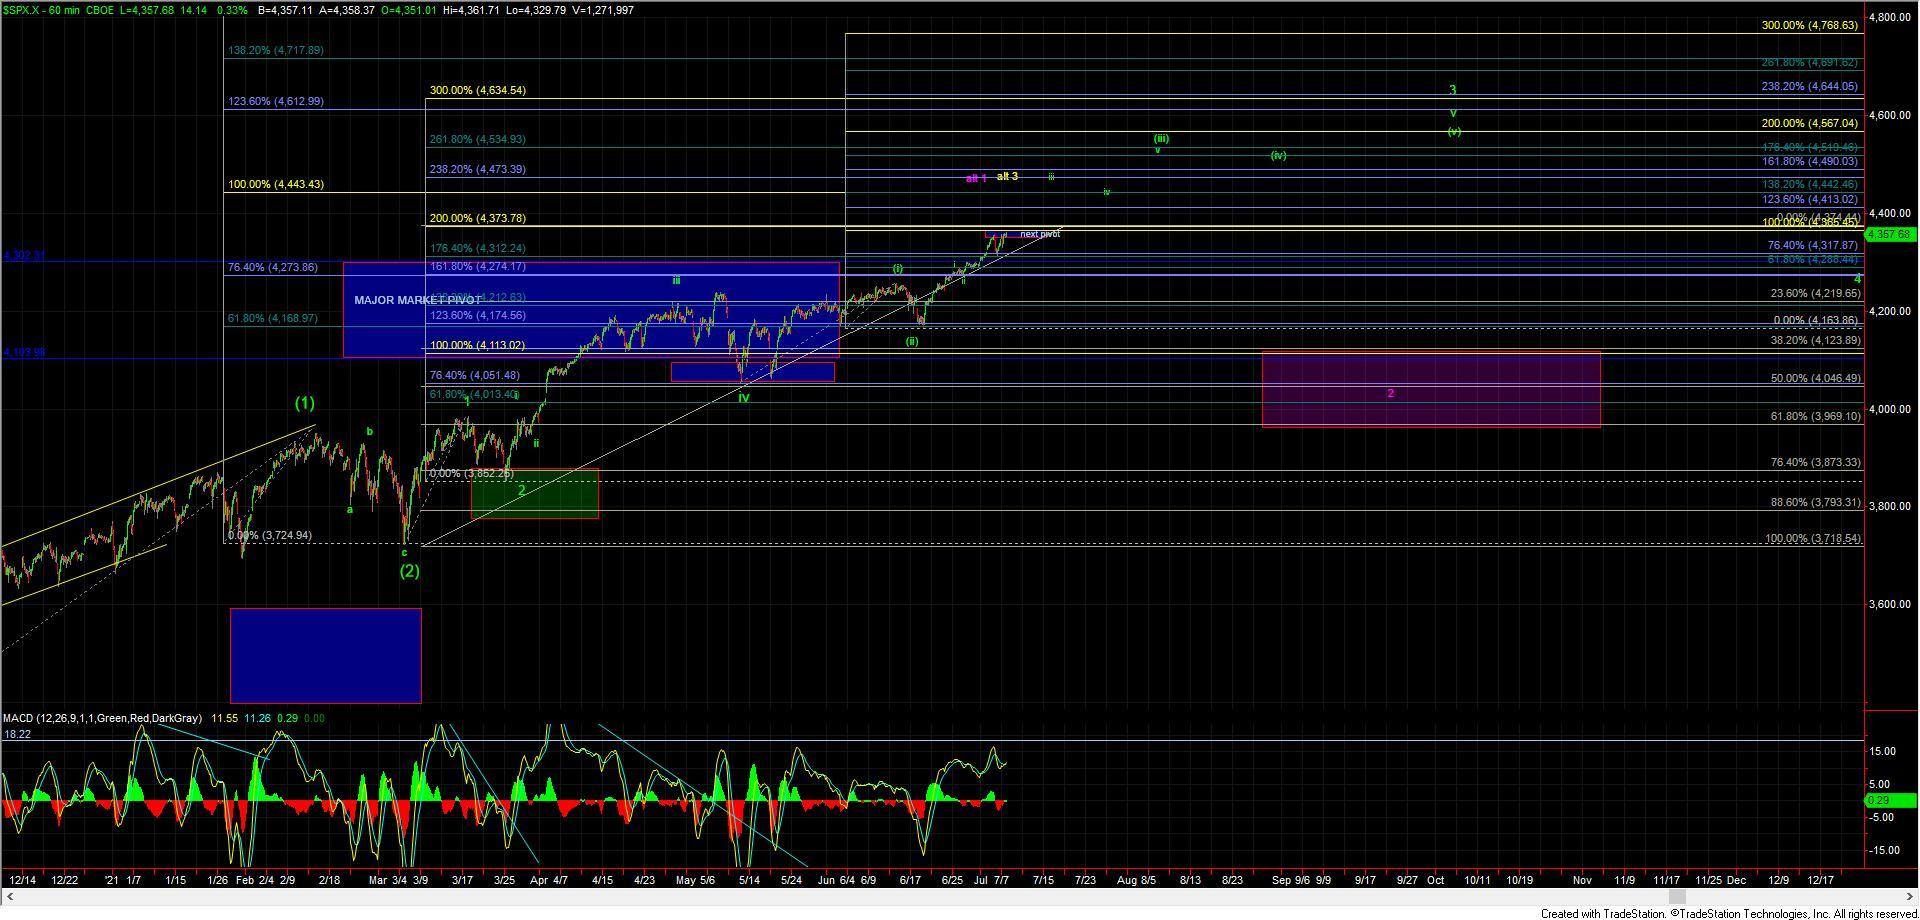
From here we ideally should hold over the 4320 level and continue to push higher with a move over the 4369 level and then ultimately over the 4393 level which will provide us with the next signal that we are indeed breaking out higher towards the 4495-4558 zone for the wave iii up off of the June lows. A move into this zone should then set up a push towards the 4600 area for the topping area of the wave 3 which is shown on the 60min chart.
If we are unable to hold the 4320 level and then see downside follow-through back under the 4285 level then it would open the door to this having formed a larger degree top. As noted yesterday that top could take the shape of the wave 3 that Avi has laid out in his weekend update or still possibly the larger degree wave 1 which, while less than ideal, I still have not fully ruled out. I am showing this wave 1 top in purple on my 60min SPX chart (charged from yellow) to align with Avi's current alternate color labels. While the overall large degree pattern would be different under those two scenarios should they occur in the near term they would actually look very similar as they both would be larger degree corrective patterns that have similar support regions.
So with that, the key in the near term remains for the most part the same as what I noted yesterday. We simply need to see if we are able to hold over the upper support levels noted above. Should we hold those levels and continue to push higher than which of the alternate paths we may be dealing with are really not all that relevant. If we do break those upper support levels and begin to show signs of a larger pullback sooner rather than later then we will better be able to define those key support levels which at this time are likely going to come in near the 4100-3960 region under both of the alternate paths.