Market Finds A Local Bottom, But Remains Under Resistance For Now
 By
By
After last week’s sharp decline, today we saw the market push higher. However, the structure of this bounce off the recent lows remains somewhat unclear. For now, I’m placing greater emphasis on key retracement resistance levels to guide the near-term outlook.
As long as we remain below those key retrace zones, my primary expectation is still for lower levels to unfold in the days and weeks ahead. That said, a sustained move back above these retracement levels would prevent me from fully ruling out the potential for another higher high, as we have yet to decisively break key support levels to the downside, the confirmation needed to firmly establish that a top is in place.
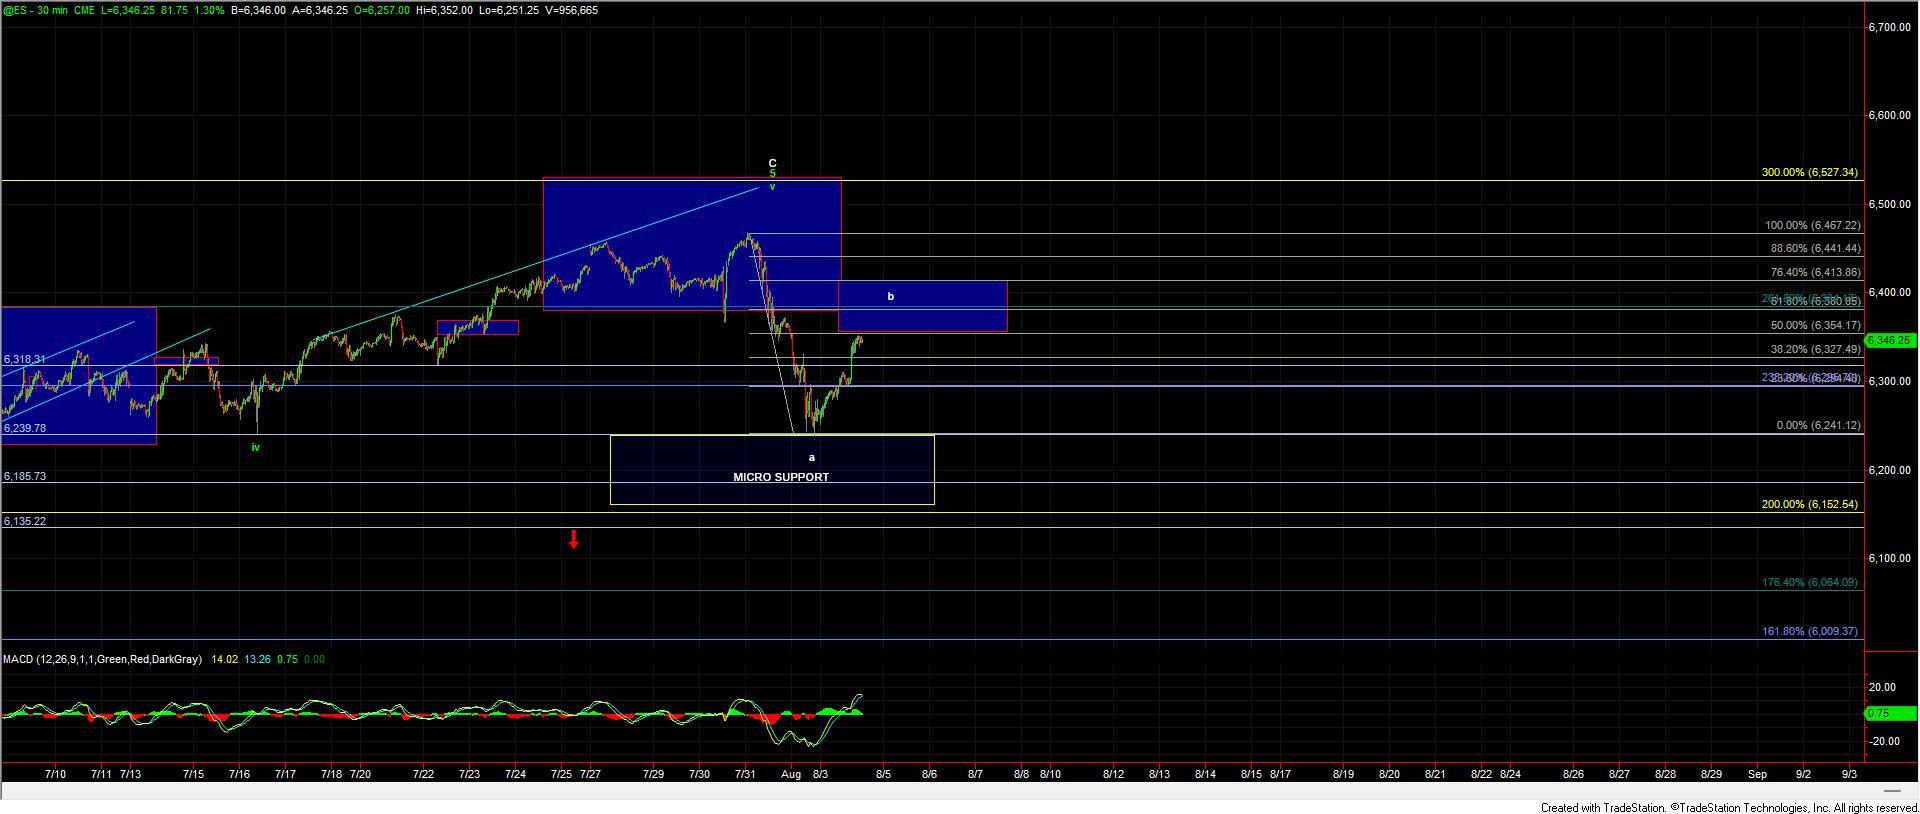
Looking at the ES chart, we currently have overhead resistance in the 6354–6418 zone. As long as the price remains beneath that zone, the path of least resistance remains to the downside. To confirm that a larger wave c decline is underway, we would need to see a clean five-wave move down off one of these fib retracement levels, followed by a break of last week’s low.
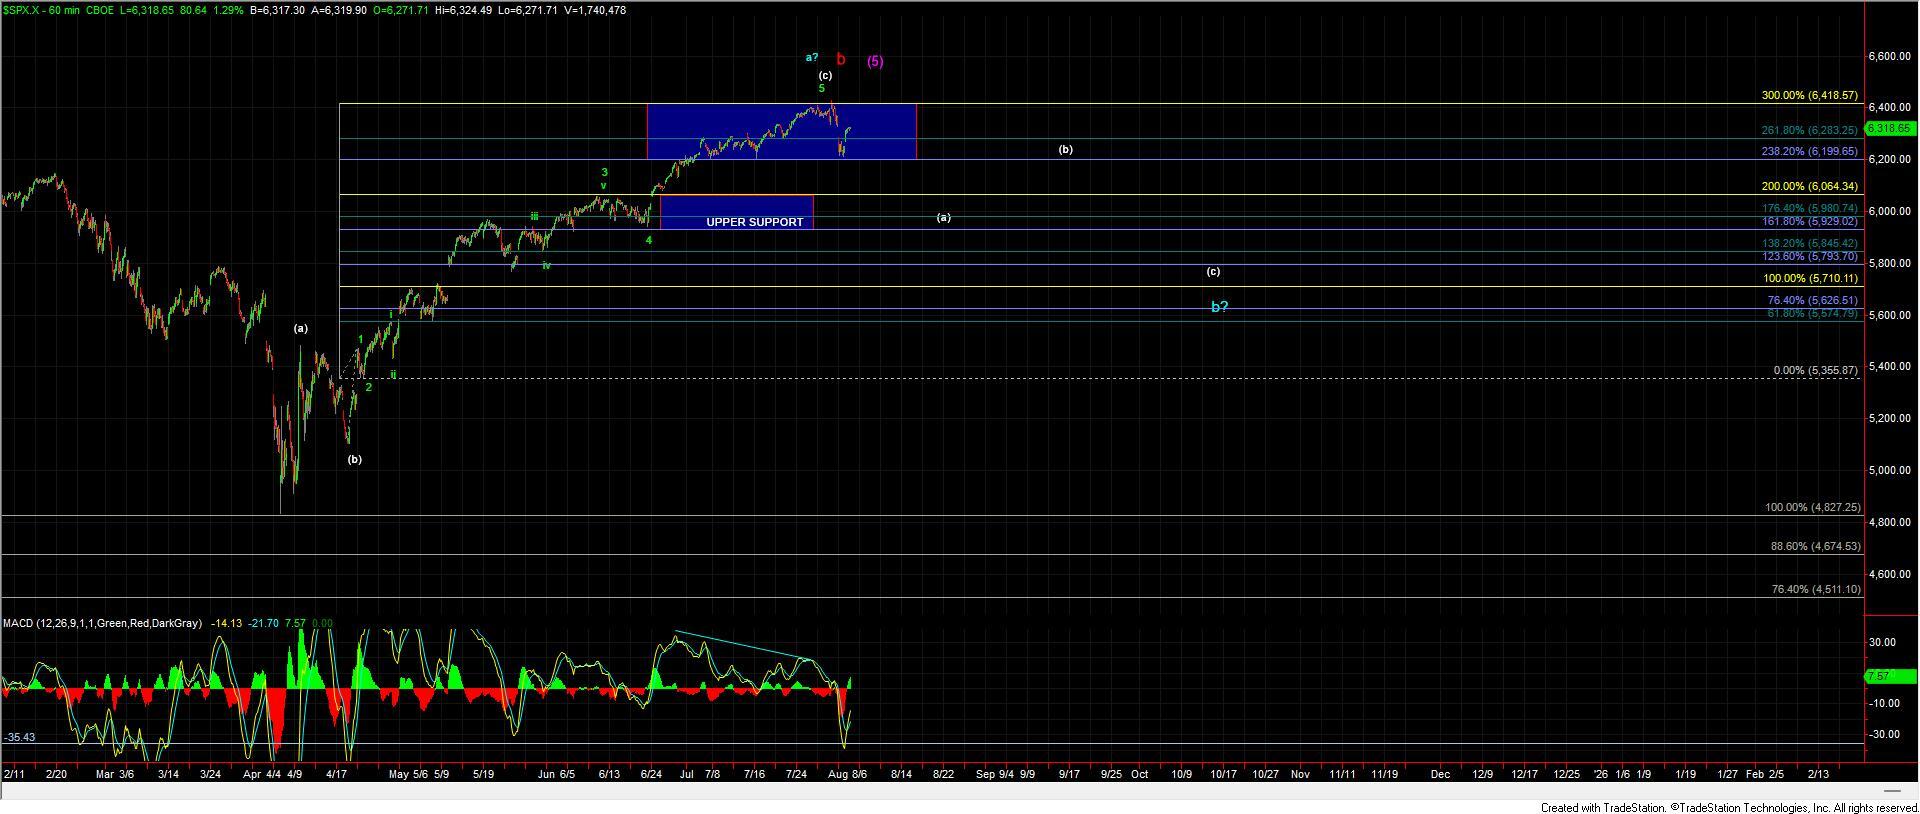
On the downside, the next key support/pivot zone comes in at 6241–6152 ES. A move through that zone would offer stronger evidence that a larger-degree top has likely been struck. For the SPX, the larger degree support rests in the 6064–5929 region, and breaking through that level would provide further confirmation of a completed top.
However, if the ES sees a sustained break through the 6418 resistance level, that would reopen the door for a continued move higher toward the 6527 region above.