Market Finds A Bottom After Some Wild Swings
 By
By
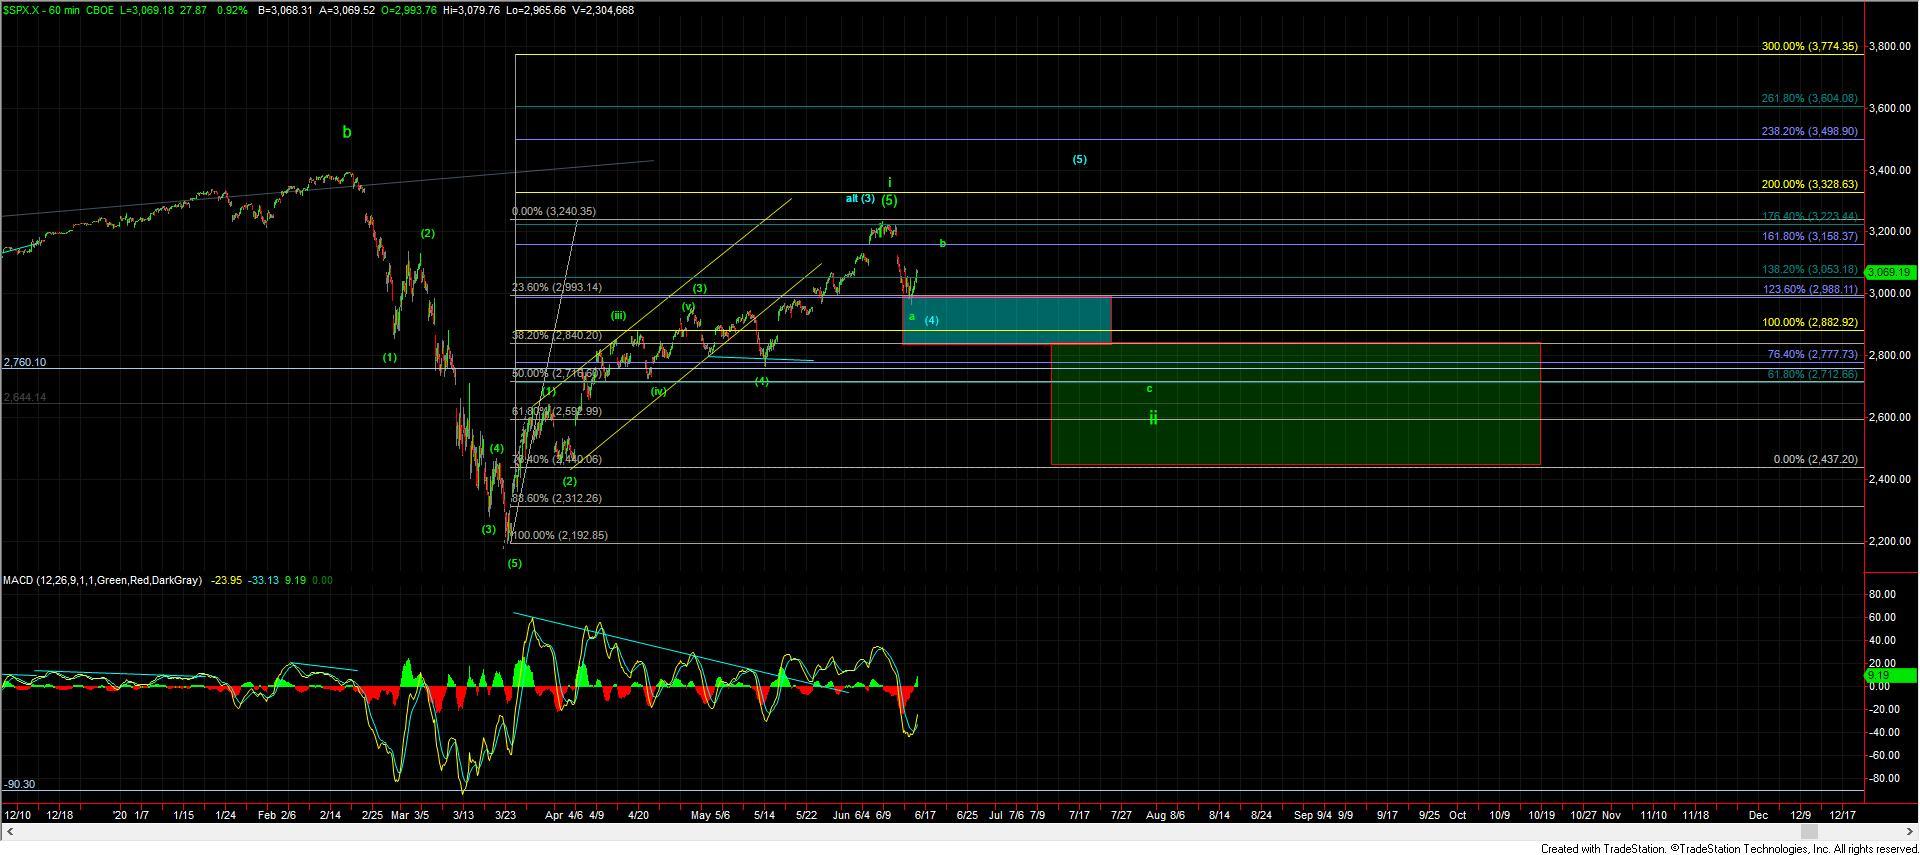
Today we opened significantly lower but managed to find a bottom early in the session and then breaking through some key resistance levels giving us confirmation that we have indeed struck at least a local bottom from the move down off of the 3240 high. There has been a lot of questions today regarding the green vs. blue counts so I want to spend a little bit of time addressing that. At this point in time both counts are still very much in play and we do not have even initial confirmation that we may have formed a bottom in the blue count just yet.
To get even initial confirmation of a bottom in the blue count we would need to see a full five wave move up off of the lows, which again we do not have just yet. That said even if we do get a full five up off of the lows this still could be an a wave of a larger abc pattern or even the final part of the b wave as the bottom could very well be counted as an irregular expanded b wave low. As far as what price levels we would need to break to invalidated the green count is concerned we are also still very far away from that level as the green b wave could see a very deep retrace back up towards the previous high and still be valid. So for now both counts remain valid and we need to keep a close eye on the smaller timeframe structure to help give us further guidance as to whether the blue count will remain in play.
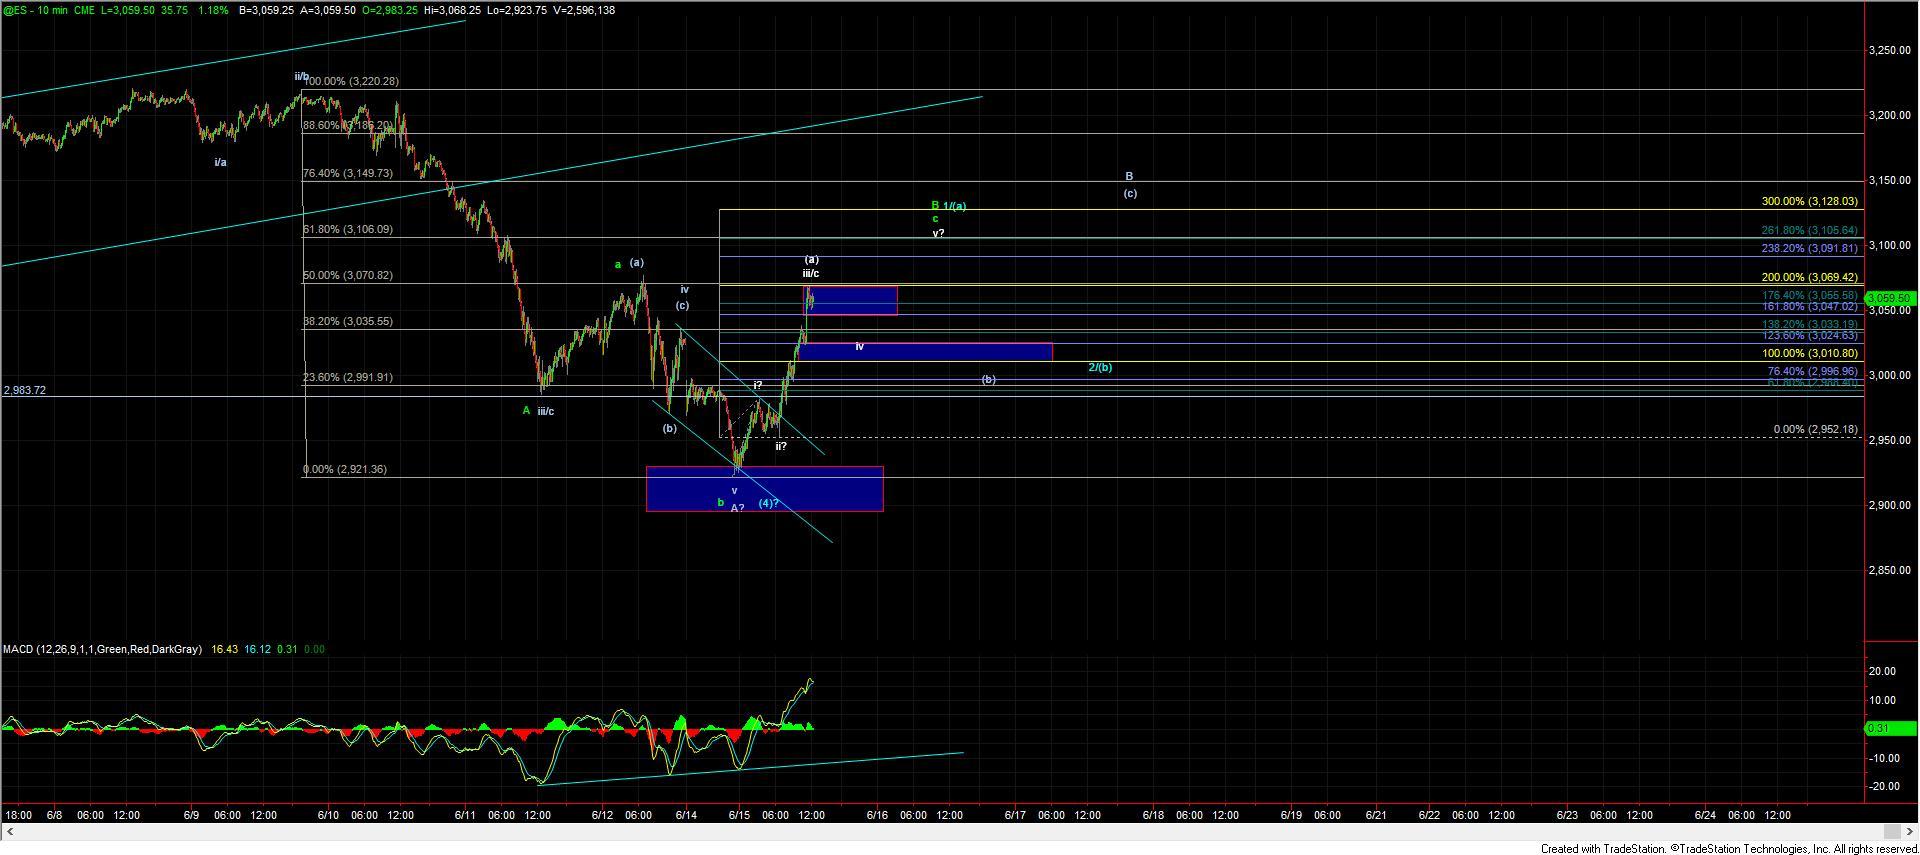
So zooming into the smaller timeframe charts we still have three waves up off of the low as shown on the ES 10min chart. If we can mange to hold over the 3024-3010 on a retrace lower and then make another high that would give us a full five up off of the lows. If we are able to get a full five up off of the lows then it would open the door to the blue count having already struck a bottom and then we could look towards a corrective three wave retrace to give us further confirmation of this low. Now with that being said I still would want to caution that even if we do get a full five up off of the lows it would not give us final confirmation that we have bottomed in the blue count as we can still count that five up as part of a larger abc pattern OR as part of a larger expanded flat as shown in green on the 10min ES chart.
So for now I want to take this one step at a time and will keep a close eye on the micro support at the 3024-3010 zone to see if we can indeed hold that level and push higher to give us a micro five up. If we can then we can address some of the other possible paths but if we are unable to hold it and see a confirmed three wave move up off of the lows then it would make things a bit more straight forward as we can eliminate some of the possibilities on the smaller timeframes.