Market Deciding If It Wants To Jump
With the ES being open over the holiday whereas the SPX was closed, the patterns in the two charts do look a bit different. So, I am going to make this update simplified based upon the commonalities of the two charts.
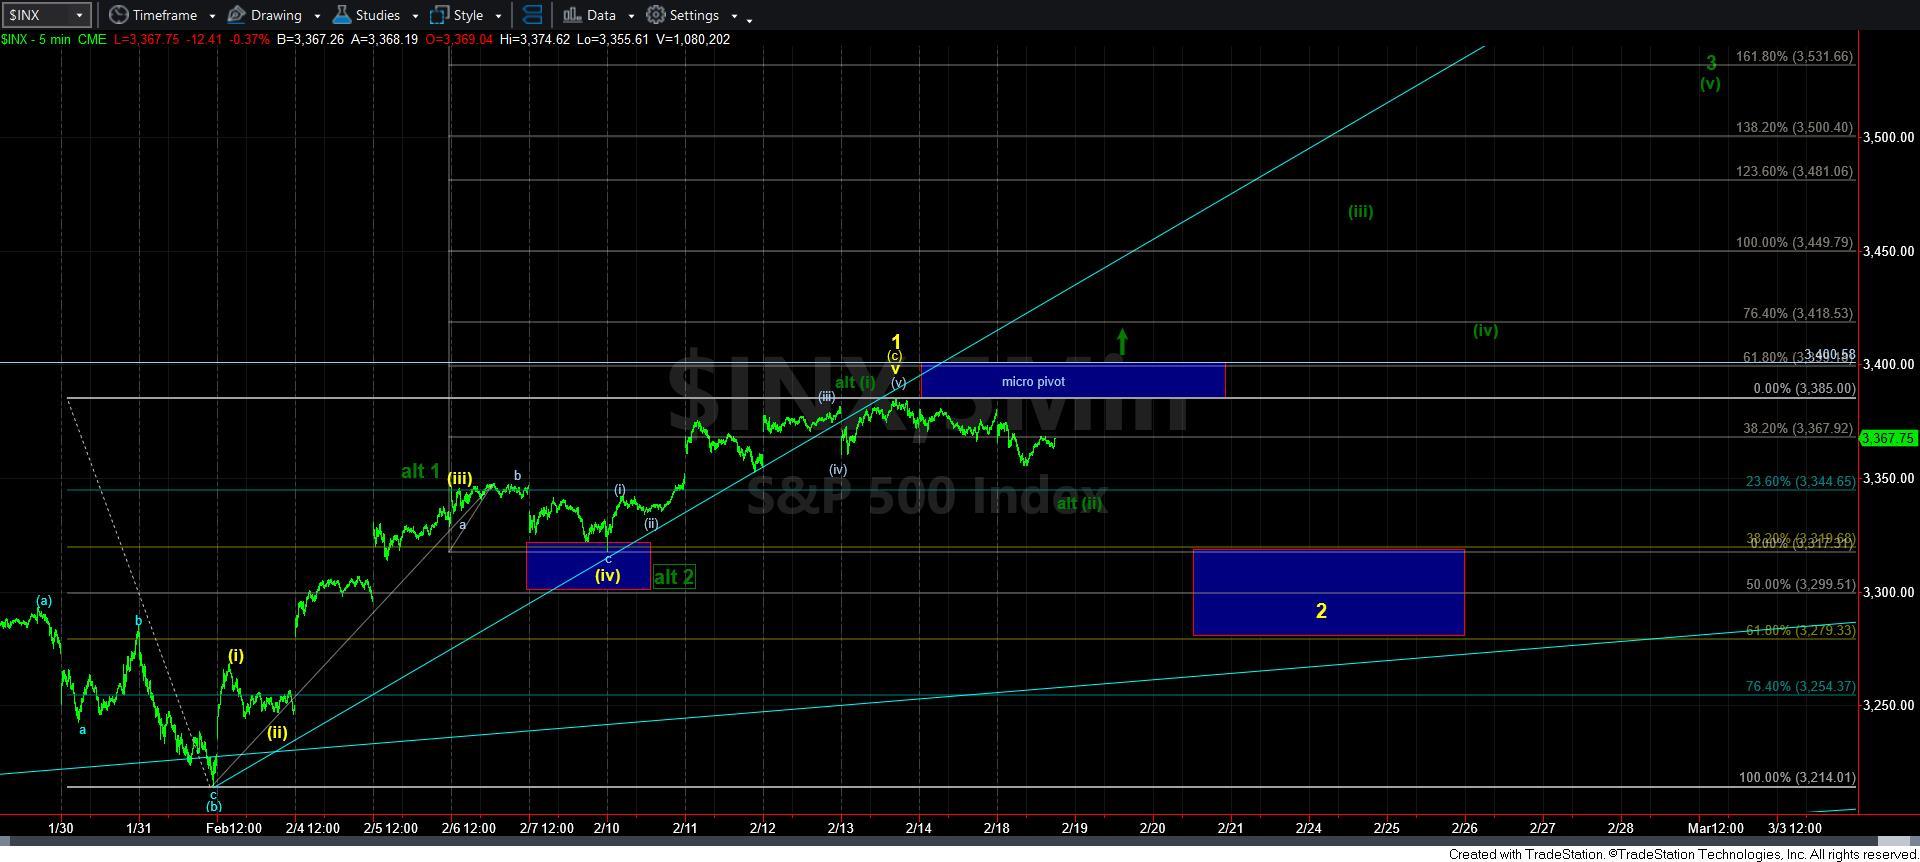
I am viewing today’s low as the bottom of the a-wave of a larger [a] wave in wave 2, as shown in the yellow count on the ES chart. The main reason I am count it as such is because the [a] wave of wave 2 most often targets the .382 retracement of the prior 5 wave rally. Since we have not attained that target, this is the reason I am only looking at today’s low as only part of the [a] wave.
But, I must also note yet again that this market has not provided us with standard pullbacks for over a year. So, I will let you know now that if we drop down to the .382 retracement at the top of the box, I will be viewing that as an alternative wave 2 low, as we will then have the minimum number of waves in place for a wave 2.
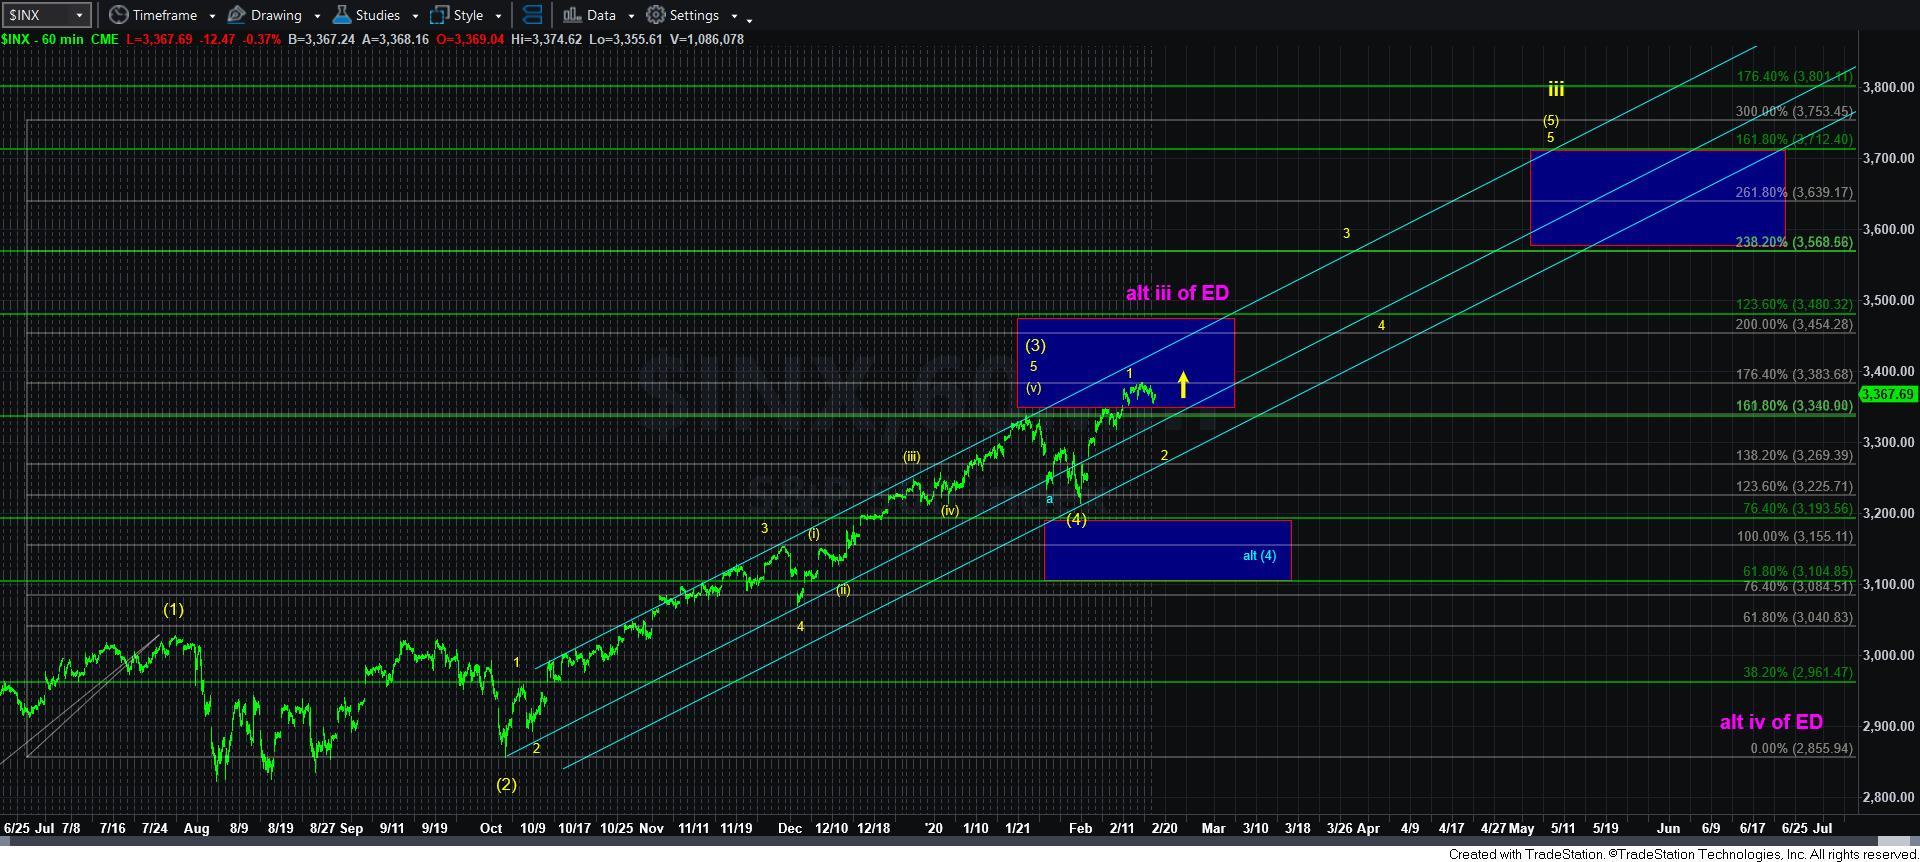
Alternatively, if the market is able to break out through the yellow b-wave box on the 3-minute ES chart, then it will make it more likely that the more immediately bullish dark green count will be pointing us to the next major resistance region in the 3455-80 region and likely rather quickly.
So, in summary, as long as the ES remains below the 3383/85 level, I can maintain an expectation for a deeper wave 2. Through that region, and the probabilities begin to shift towards the more immediate bullish potential.