Market Continues To Push Higher But Still Has Some Hurdles To Overcome
 By
By
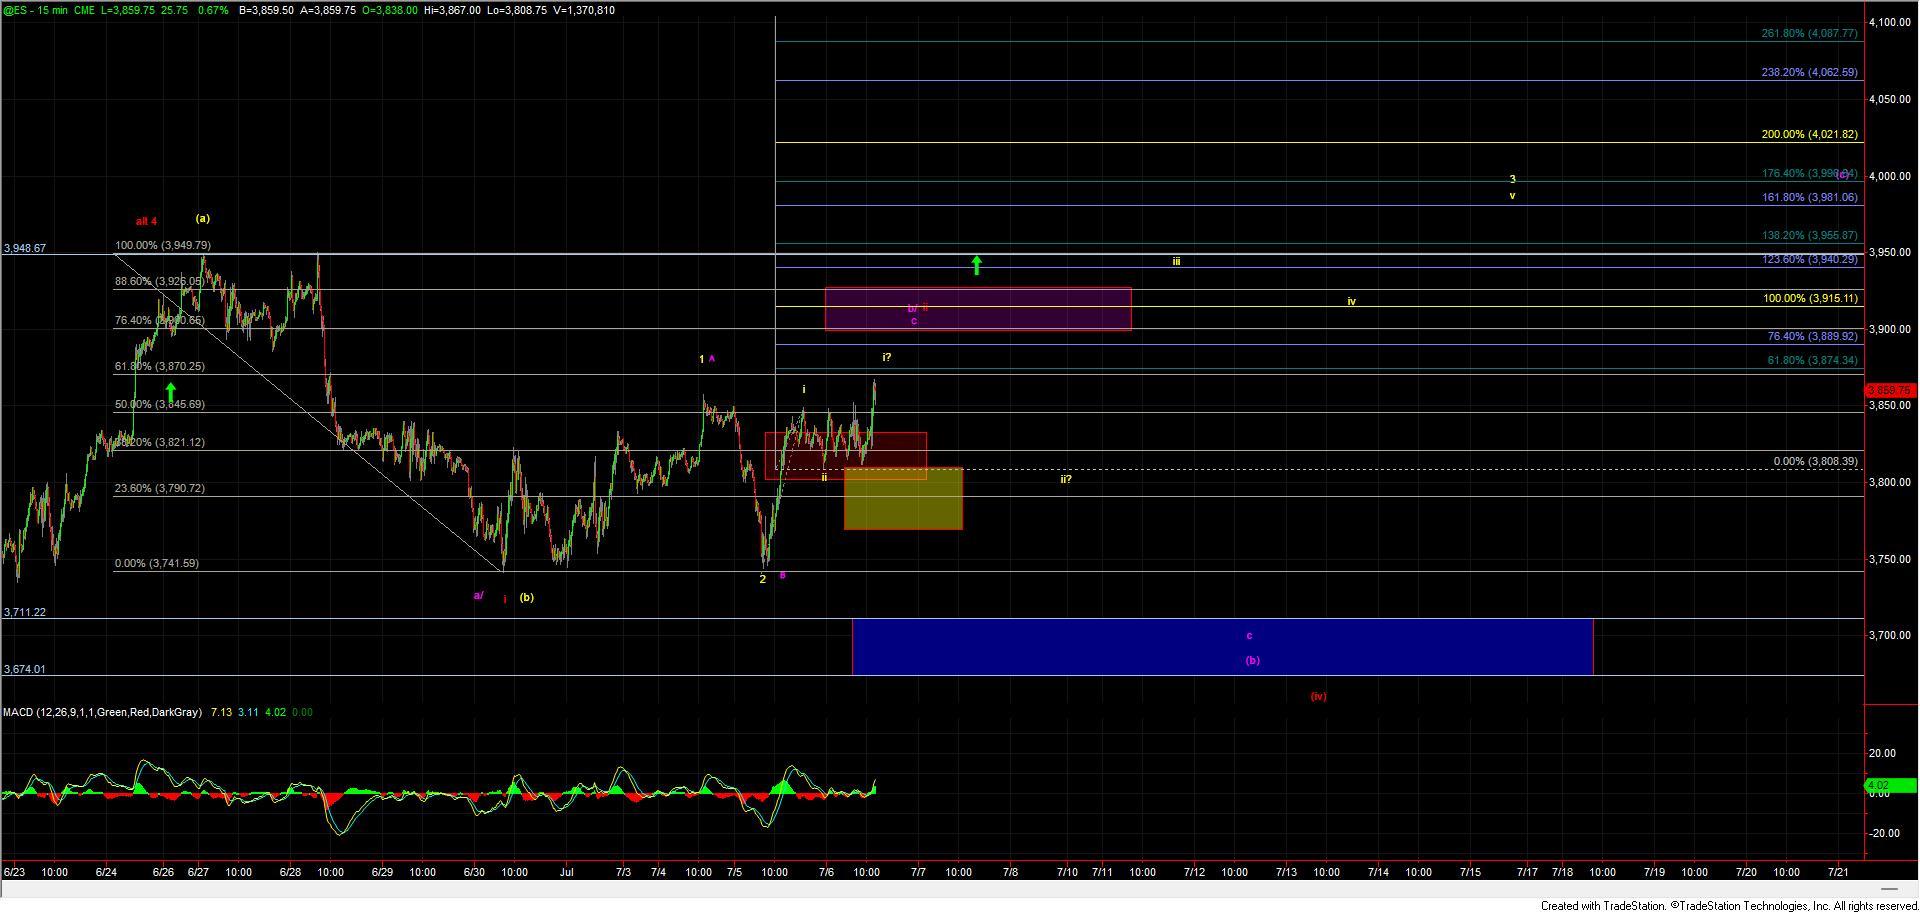
After pushing higher yesterday we saw the markets consolidate throughout most of the day with the final hour of trading finally see a breakout higher back over the 3858 level. The break of this 3858 level allowed us to remove the most immediately bearish count that was pointing us lower in the form of a nested i-ii (i)-(ii) to the downside but the market does still have a bit or work to do give us confirmation that we are indeed heading back up over the 3949 high before swinging lower in one of the paths to the downside that I have laid out below. In fact, the price action over the past several days is still not terribly conducive to following the impulsive yellow count so until the market is able to push over resistance I am still quite cautious here even with this push to new highs today.
Yellow Count
The yellow count which is the most immediately bullish count would still suggest that we are in the process of seeing a wave (c) up with the LOD yesterday being a wave 2 of that wave c. This wave (c) would likey to be part of a larger corrective pattern or even part of a larger leading diagonal up off of the lows but in either case, it should see a move beyond the 3948 high on the ES and ideally target closer to the 4024-4097 zone. Under this case, we now need to see a push back up over the 3900-3926 zone which represents the 76.4-88.6 retrace zone of the move down off of the 3949 high. The 100ext of the potential wave i of 3 of that C also lies right in the middle of that zone. So seeing a push through that zone would give us initial confirmation that we are indeed going to see a direct break of that 3949 level while following the yellow wave 3 of C up. I do want to note that as long as this si under the 3889 level it is still possible to see a pullback before breaking directly higher even under that yellow count. If that pullback takes a corrective three-wave form then the yellow count still would remain valid and a push to new highs still very much in play. If however, we see a pullback lower take the form of a five-wave move to the downside then it would open the door for this to be forming a top in either the purple wave b or the red wave ii.
Red Count
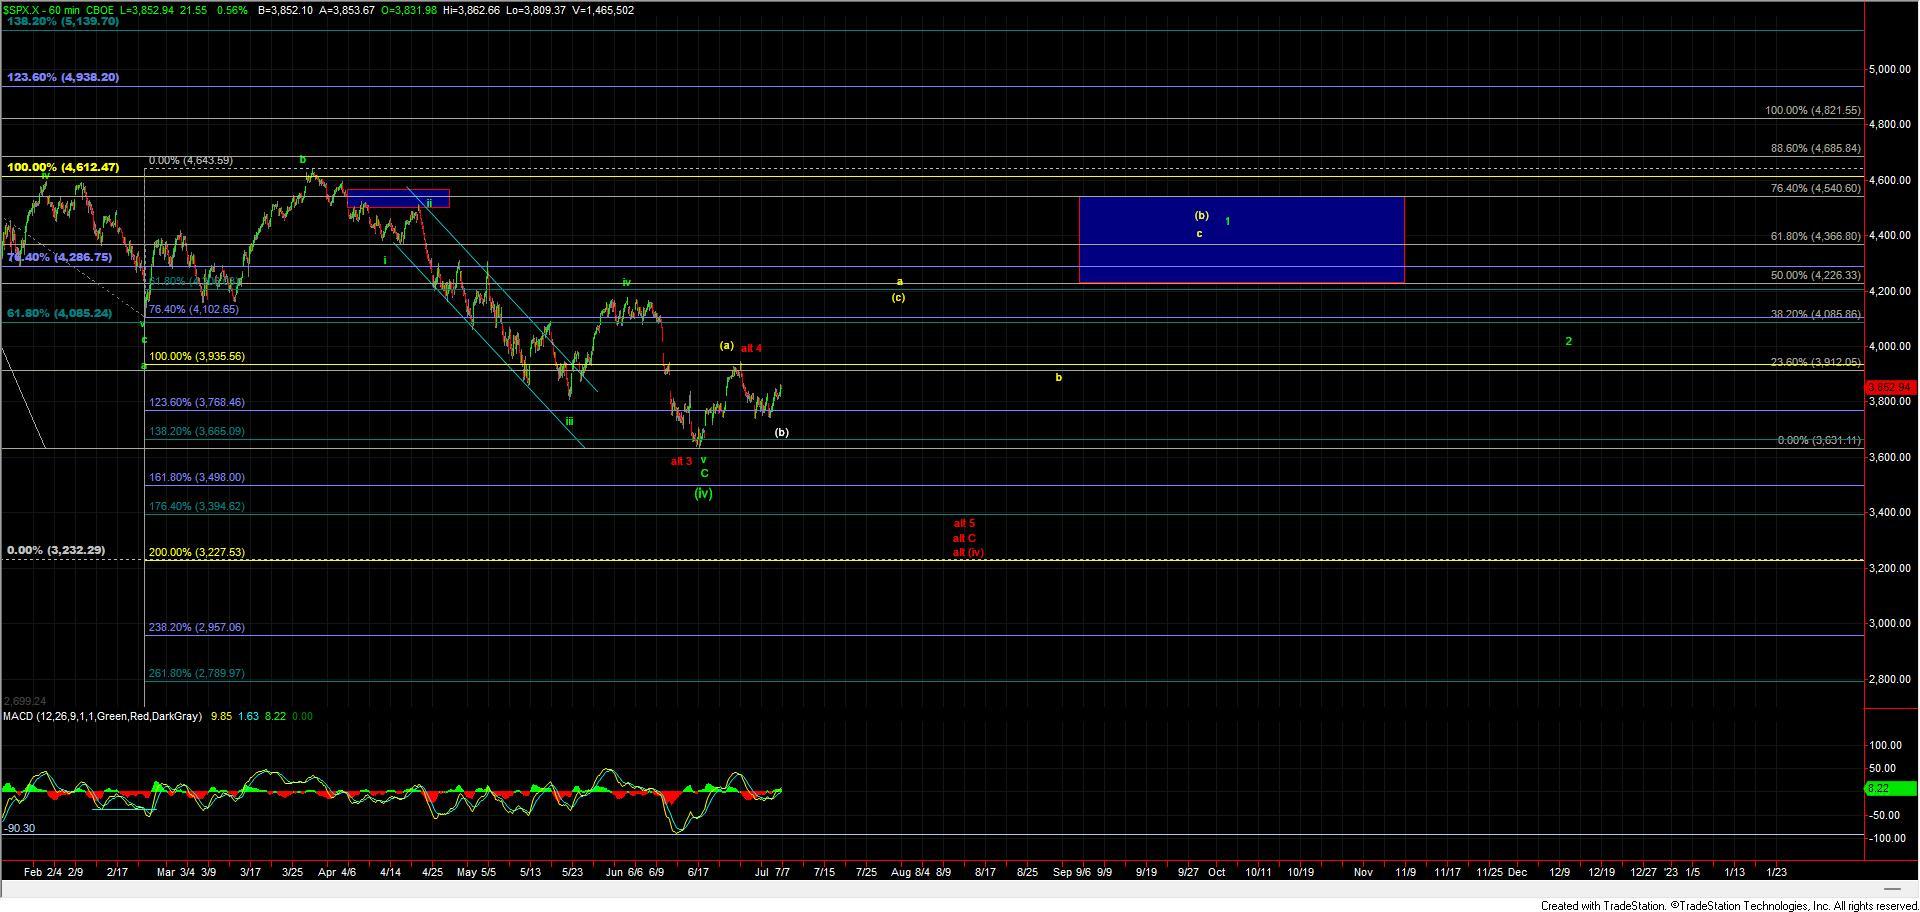
While we did take out the nested i-ii (i)-(ii) today with the breakout over the 3858 level I still cannot rule out that we are forming a larger i-ii to the downside as shown on the ES chart. This larger i-ii would take a very similar path to the purple wave b top in the beginning however the red count would project back down to new lows under the 3638 level whereas the purple count would hold those levels before turning higher once again. If we do break down below that 3638 level per this red count then we still would be projecting down towards the 3500-3450 zone below but again to open the door to this count we need to start the next leg down with a full five wave move.
Purple Count
The purple count would be following a very similar path to that of the larger i-ii down in red although instead of making a new lower low towards the 3500-3450 zone we would likey hold the 3712-3674 zone and bottom in a larger wave (b) before heading higher. This path would ideally top out around the 3863-3924 zone before moving lower in the wave c of (b). As noted above this path would start out very similarly to the larger red i-ii but again would not make a lower low and turn higher before breaking the 3639 lows. This may be the most painful path for both bulls and bears so it is one that I am keeping a very close eye on here as we move into the 3900-3926 resistance zone just overhead.
While still sloppy today's action did at least eliminate one of the most immediately bearish paths and the structure of the price action over the next couple of trading sessions along with the price levels noted above will help to continue to give us guidance in what is very difficult price action to track. So while the market is still not quite out of the danger zone we do know where those zones are thus allowing us to plan accordingly. For now however and until we clear those levels I do still remain cautious and am not taking anything for granted in what still remains a difficult and precarious market.