Market Continues To Move Higher But Still Has Some Hurdles To Clear
 By
By
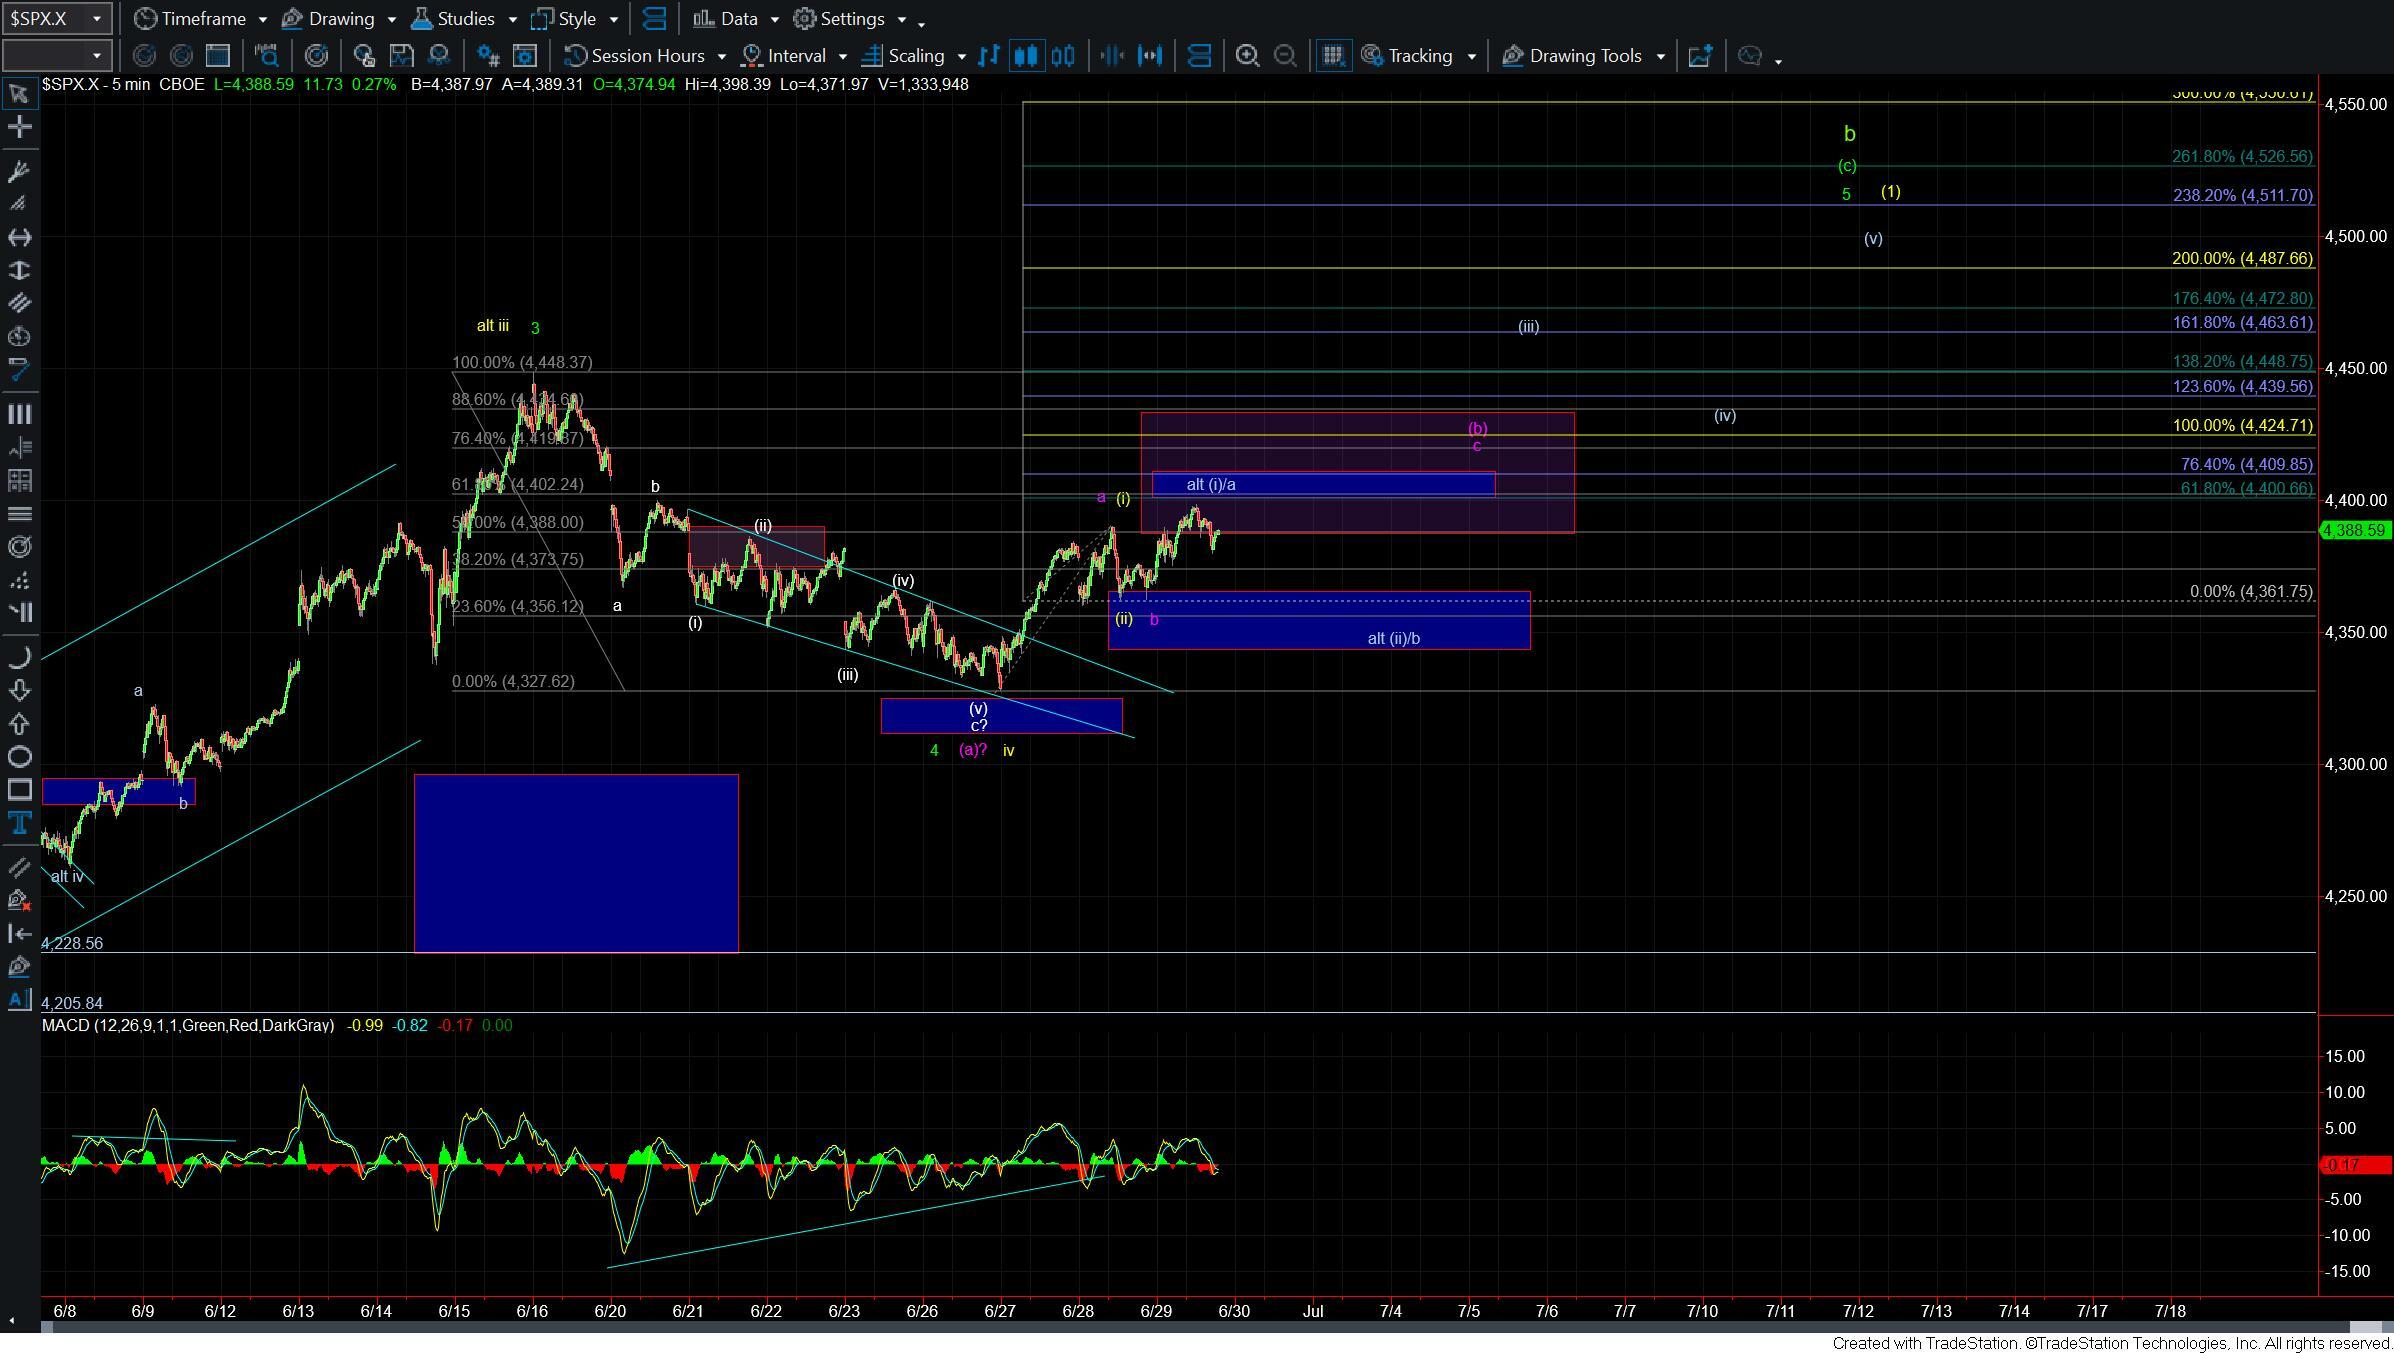
Today the market opened relatively flat but the proceeded to push to a new high over yesterday’s high. That move to new highs is opening the door for this to already be in the wave (iii) or c up off of yesterday’s low on the more micro timescales. We do however still need to move through the micro pivot at the 4400-4409 zone on the SPX before we can confirm that this is indeed the case. Unless and until that occurs, I still can’t fully rule out that we will still see a deeper retrace over the next couple of trading sessions before pushing higher.
If we do continue to push higher and through the 4400-4409 pivot on the smaller degree timeframe charts (whether after a pullback or in a more direct manner) the next key resistance we need to watch for is the 4421-4436 zone. Moving through that zone would then make the purple count less probable with further confirmation coming with a break over the 4448 high thus putting us in either the green or yellow counts.
I laid out the path for those green and yellow counts and the parameters to look for in great detail yesterday so I am simply going to re-iterate what I noted then as nothing has changed from a bigger-picture perspective.
GREEN COUNT
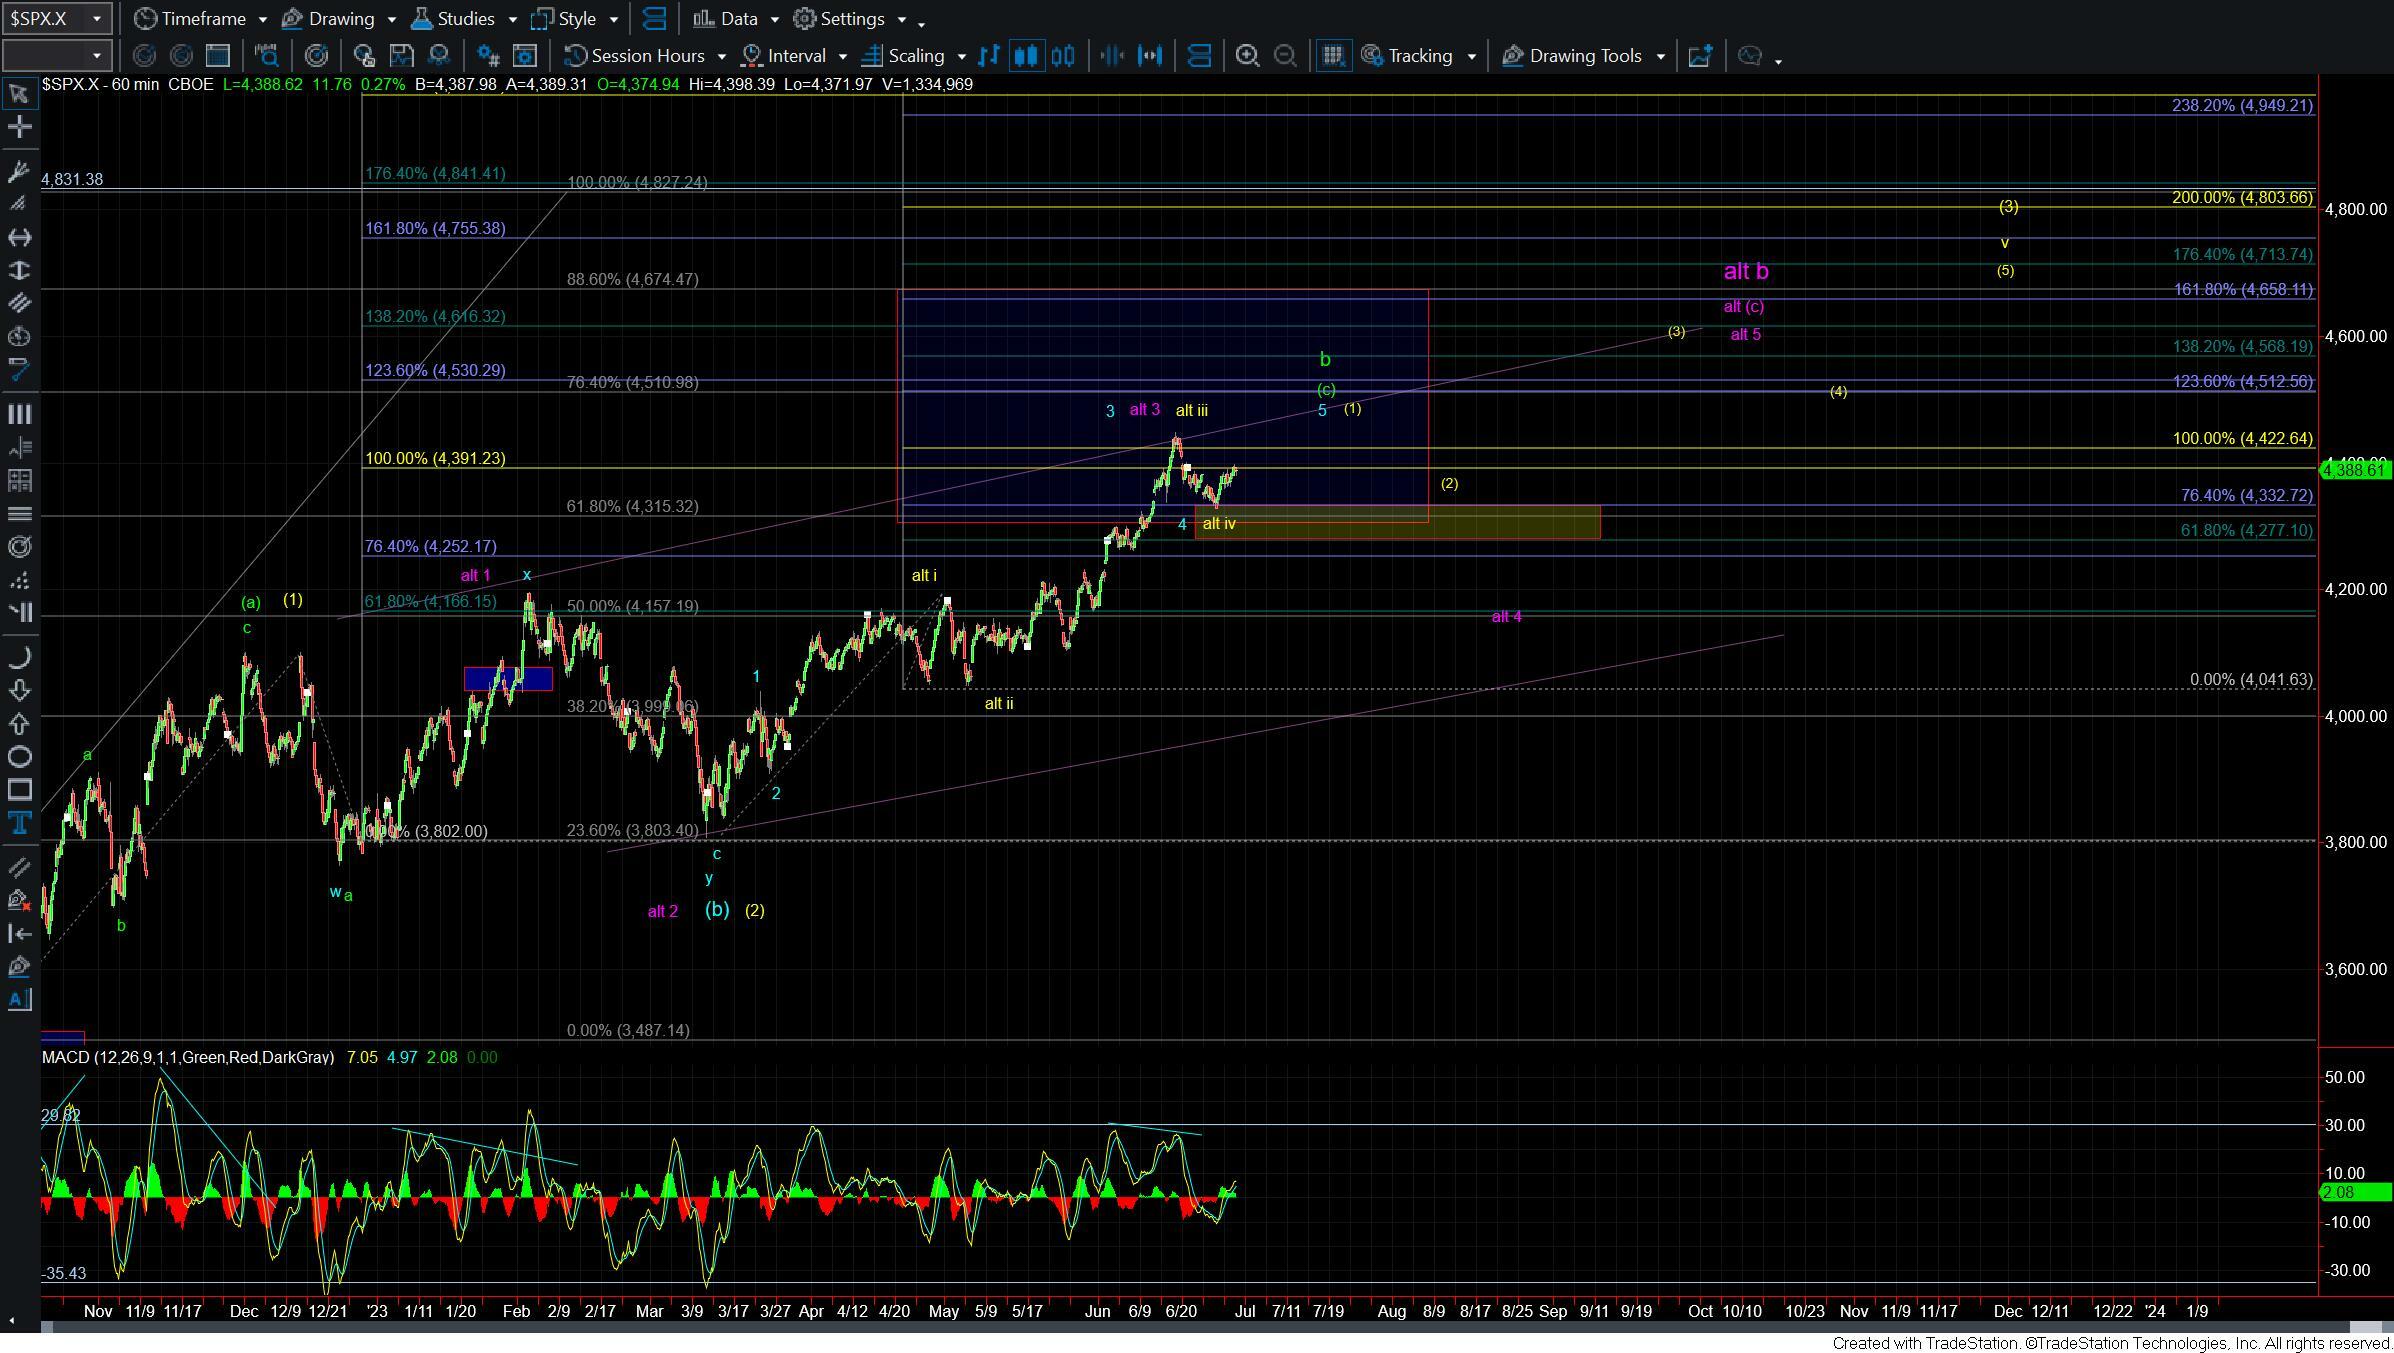
As I noted yesterday because the sharp move higher off of Tuesday’s low gave us what counts best as a three-wave move down off of the highs it is much less probable that we have already topped in the green wave b. With that if we are going to see a top under that green count it is more like that we will need another push higher into the larger degree overhead resistance zone and back over the 4450 high before we can call a confident top in that green wave b. The potential five up off of yesterday's low has this move project into the 4468-4510 region which also has good confluence with the 76.4 retrace level of the entire move down off of the 4831 high that was struck back in 2022.
We still would need to move through the overhead resistance zone at the 4388-4432 zone overhead to give us further confirmation that we are indeed heading to new highs and filling out the five up off of yesterday's low to finish off the green wave b into the 4468-4510 region. After topping in that region we would then need to see a full five down of off of those highs to give us the initial signal that we have begun the wave c down and that would then need to be followed up with a break back under yesterday's low at the 4327 level.
If we break out to new highs but only see a clearly corrective retrace that holds over yesterday's low then it would be the initial signal that we are following through with the yellow count.
YELLOW COUNT
Yesteday’s five up after holding support is keeping the door open to the yellow count and this path will likely be very similar to that of the green count even with a push to new highs. So it is important that we remain vigilant if we do see a push back up over the 4448 level we will likely begin to see many calling for a push to new all-time-highs and many feeling a large degree of FOMO.
The structure of the next pullback upon a full five up of one larger degree and push to new highs is going to be critically important and something that we need to be watching very closely. Again IF that move down after a push to new highs is clearly corrective then it would keep the door open to the yellow count and a push to new highs. IF however that move lower is five waves down the risk that we are beginning the larger wave C down is greatly increased. That C wave down will not be pretty so again even if we push to new highs the structure of the pullback after that push will be critically important.
PURPLE COUNT
Finally, the purple count is still in play here and under this count, we would need to hold under the 4387-4434 resistance zone and see a five-wave move to the downside that ultimately breaks back under today's LOD. This is the more sloppy of the paths that I am watching and would likey to take the SPX grinding lower before finding a larger degree bottom in the 4200-4100 region but it is certainly on my radar as I do think it fits fairly well with what I am watching on the Nasdaq charts.
With the five up I still would expect to see a push higher and deeper into that resistance zone even under this path. Stalling at one of the key overhead fib resistance levels and seeing a five-wave move lower would be the initial signal that we are following this purple count. Moving through the overhead resistance at the 4387-4434 would however give us the initial signal that we are indeed following the yellow or green paths.