Market Continues To Levitate
Two years ago, many did not believe the market was going to rally from 1800 to our ideal target of 2537-2611SPX. Now that we have exceeded the top of our ideal target by a few percent, many are starting to view this market as having no top.
Well, I can assure you that this market will see a pullback, and I can even assure you that the market will likely see a 15%+ pullback over the coming two years, which will place us well below where we stand today. But, for now, the market is doing what bull markets love to do – extend. So, please maintain some appropriate perspective of this long-term bull market.
But, does that mean we should be aggressively long the market up here? Does it mean we should be aggressively short the market up here? The answer to both these questions is “no.” When markets extend to this degree, it is not wise to do anything aggressive until the market provides a clear break of support to align the potential wave structures across the equity markets.
To that end, I have always endeavored to identify the segment of the market that provides us with the most insight into the current market action. For example, back in early to mid-November, I cautioned quite strongly that this market will not top out until the IWM is able to complete its 5th wave higher. And, we were able to catch a nice 9% rally in the IWM off the mid-November lows based upon our analysis.
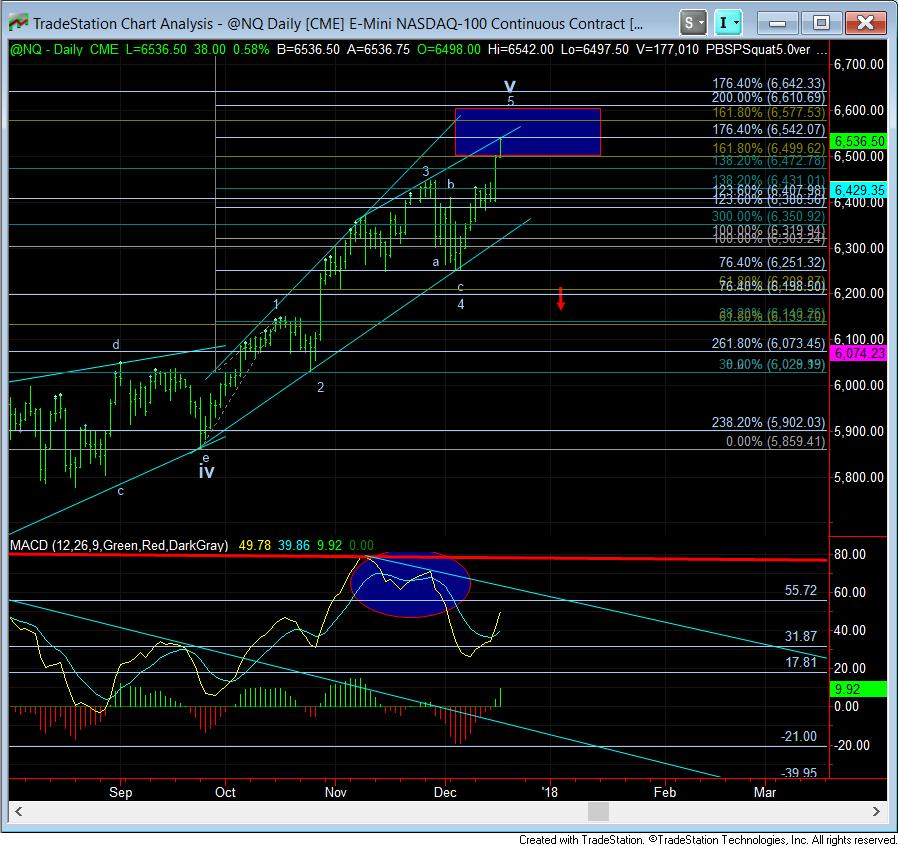
Moreover, the NQ also showed us that it was going to likely head to the target box I have had on my chart from much lower levels. So, we have had several segments of the market which have lit the way over the last two months which pointed us higher in the overall market, even though the SPX was already at the upper end of our long-term target region. And, the market certainly followed through. It should highlight to you that one must not view the market as “must” having to do anything so that you can listen to the messages being presented to you in the charts – even if it is beyond the initial expectations you set years before.
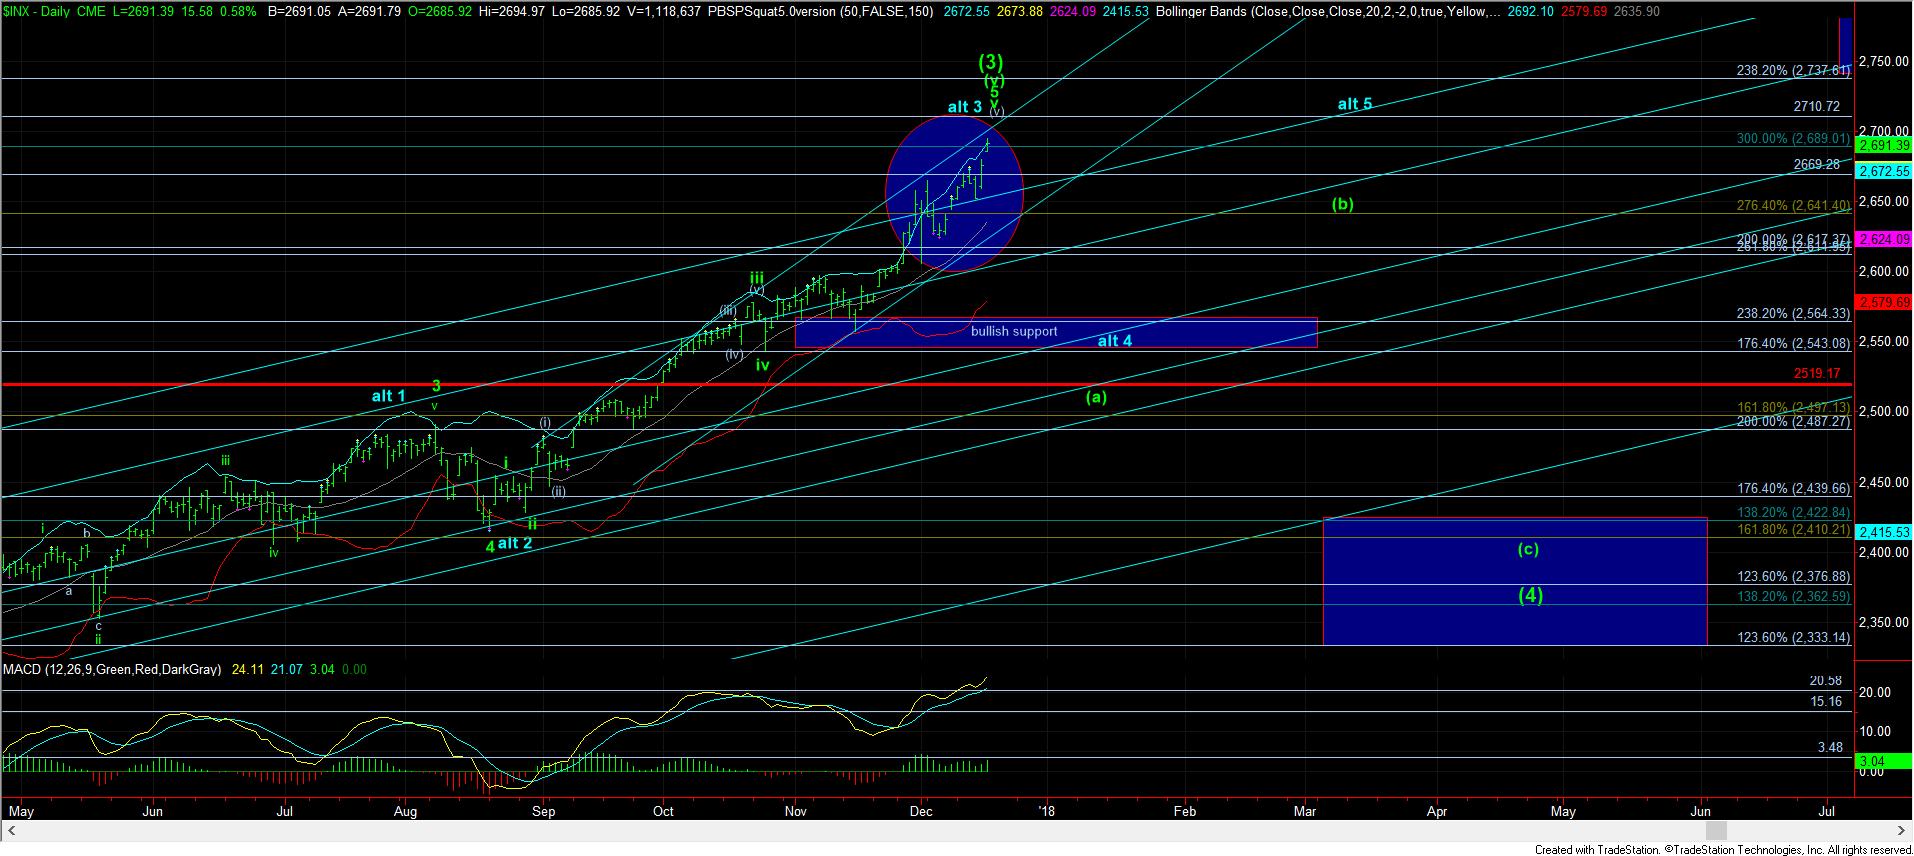
But, as we have come up this high, the SPX and the IWM have provided us with a few questions about potential topping. If you look at the attached daily chart on the SPX, you can see I have highlighted the last month of price pattern, which shows a lot of overlap in the market up here and may be indicative of an ending diagonal tracing out in the SPX. It is for this reason that I have been questioning the overall micro structure of the SPX up here.
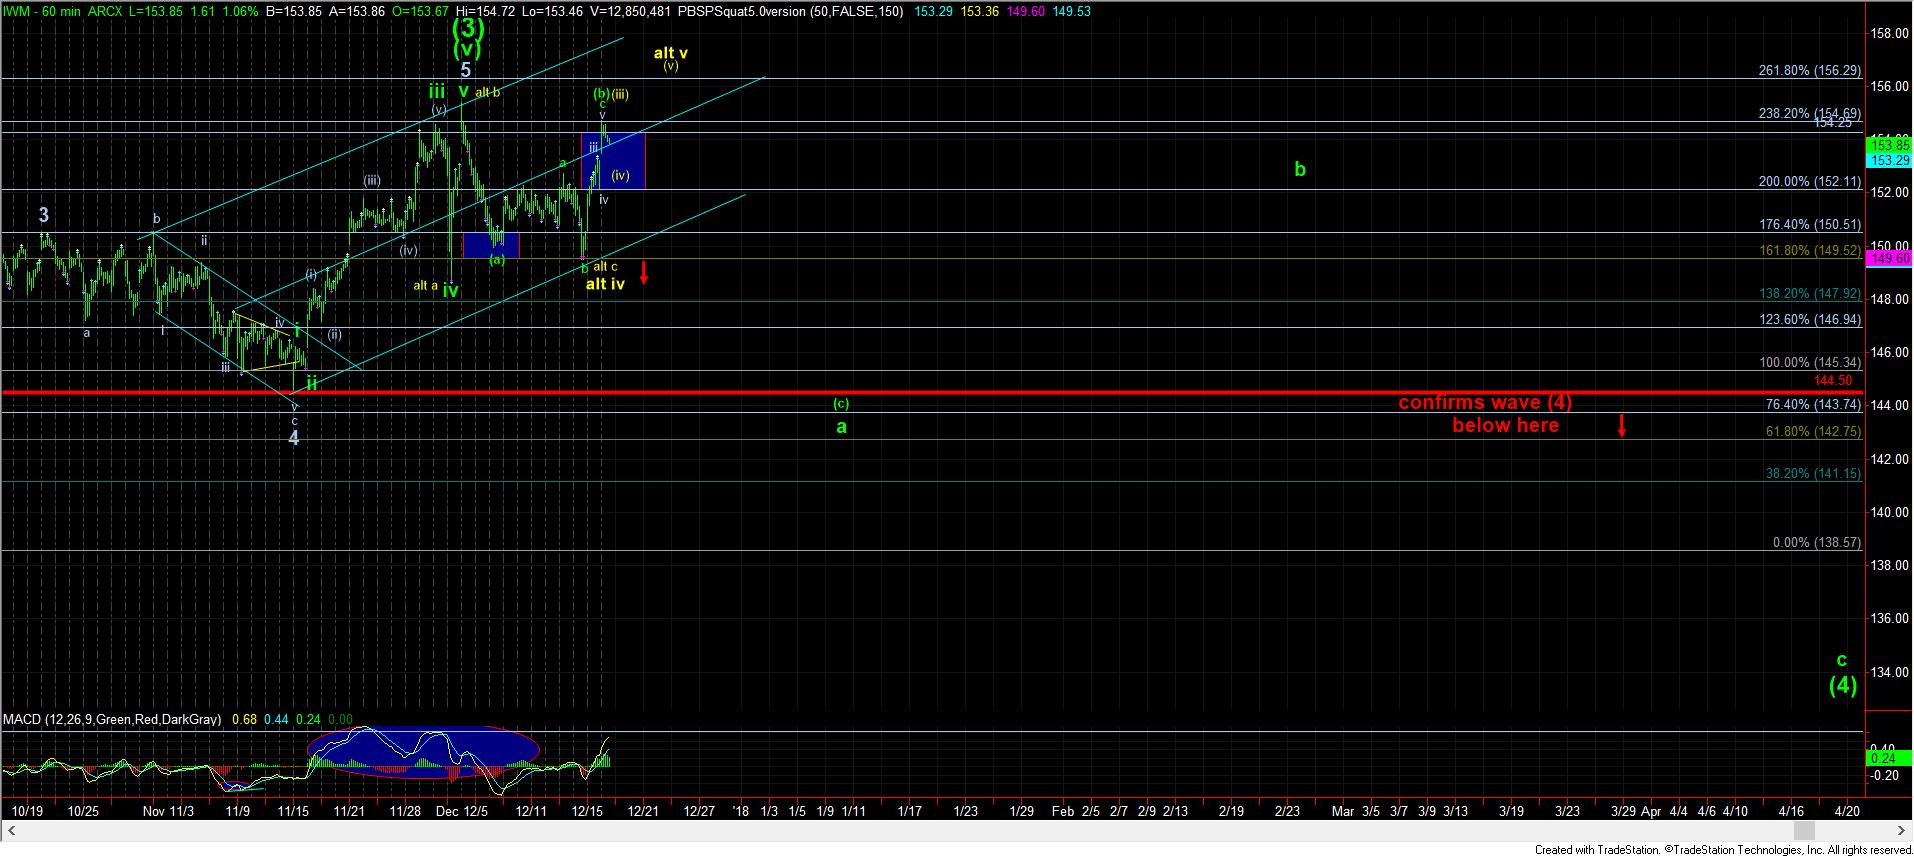
Now, let’s review the IWM. When I posted about the bottoming potential on Thursday last week in the IWM in the 149.50 region, my primary expectation was that this rally would be a c-wave within a larger (b) wave expanded flat, whereas my alternative expectation was to see a higher high. Today, the market pushed up as high as I would really want to see to support such a corrective count in the (b) wave rally. That means we will need to see a break down below 152 IWM to even begin to suggest a top has been seen, which would then likely be pointing back down to the November lows. Without such a signal, a corrective pullback (wave (iv) in yellow) can still fill in the alternative count, which would provide us with a higher high.
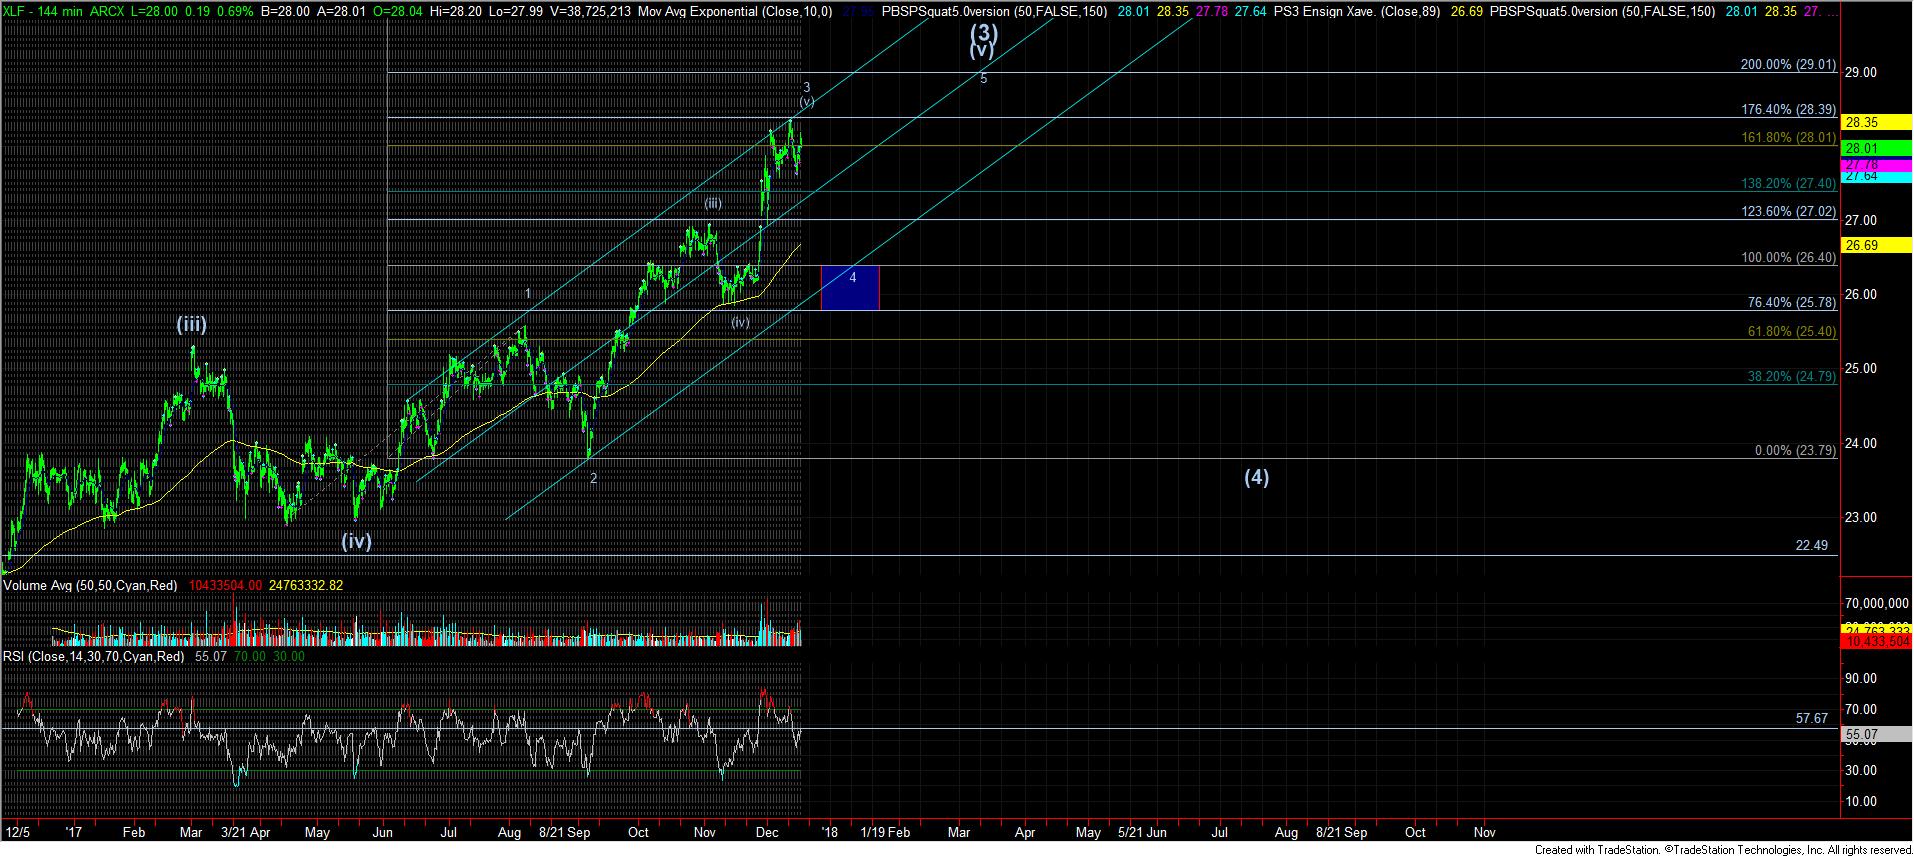
So, this now brings me to the clearest chart I have begun to take note of last week. As you can see from the attached XLF chart, it strongly suggests that it either has topped, or has a marginally higher high in store to complete wave (v) of 3 of (v) of (3) off the February 2016 lows. In fact, this chart provides us with an almost textbook Fibonacci Pinball pattern since June, which is why I have now moved into relying upon it as my primary chart for the overall market stance. And, once we break below last week’s low, it is pointing down to the 26.50 region, as I highlighted over the weekend.
As I opened this write-up pointing out that the SPX is now a few percent beyond the ideal target we set several years ago, please maintain some perspective, since we just caught a rally of 40%+ over the last two years, not including the last 9% we caught on the IWM rally from mid-November. And, we are now trying to identify how these last percentages of extensions are playing out. Again, perspective is most important at this time, so that you do not become emotional about the market.
For now, I am placing reliance upon the XLF chart, and as long as it remains over 27.63, pressure can remain higher to provide a higher high for wave (v) of 3. But, once we either complete a higher high, or break below support, I am looking for a pullback in the larger market, at least to the point when XLF returns to the 26.50 region. But, please recognize that the XLF is suggesting that the market can continue to levitate until March before a much more serious decline is seen into the 2nd quarter of 2018.