Market Continues To Hold Over Support
 By
By
The SPX moved slightly higher today but as of the time of this writing is trading fairly flat. So with that, there is still not too much to add to the analysis that we have been posting over the past several days.
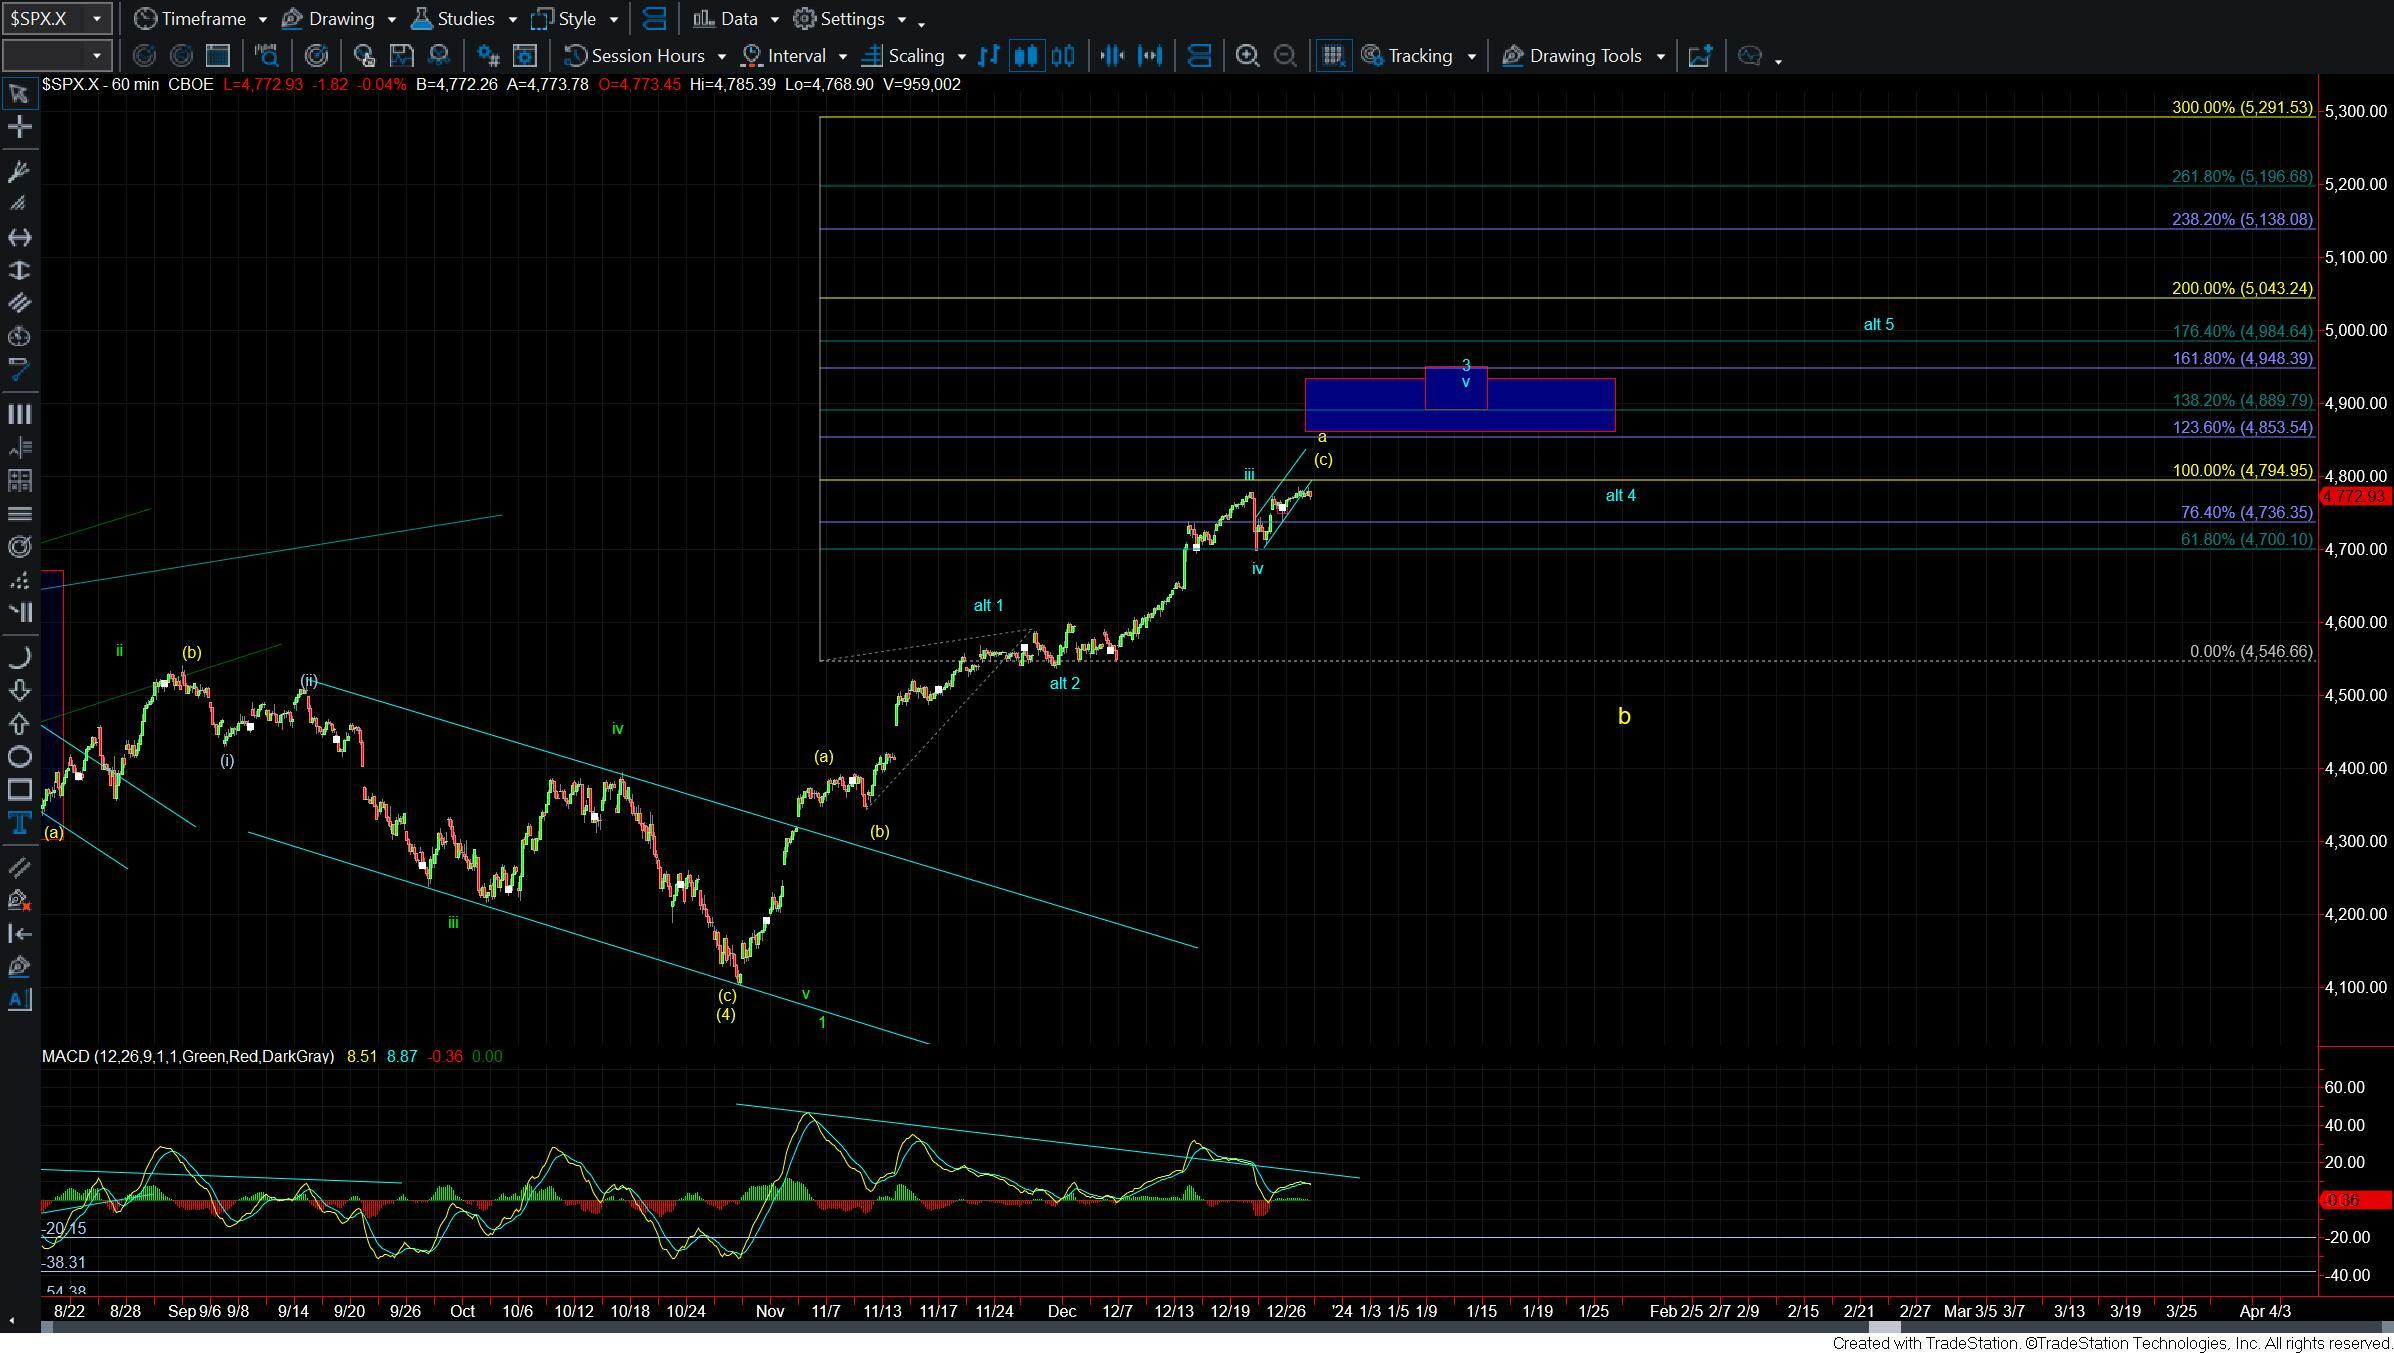
I do want to note that all of the equity charts are still quite stretched in this region and ideally should see a pullback in one form or another. The key to whether we are following the blue or yellow count on the SPX chart is going to be whether we can hold the upper pivot in corrective form.
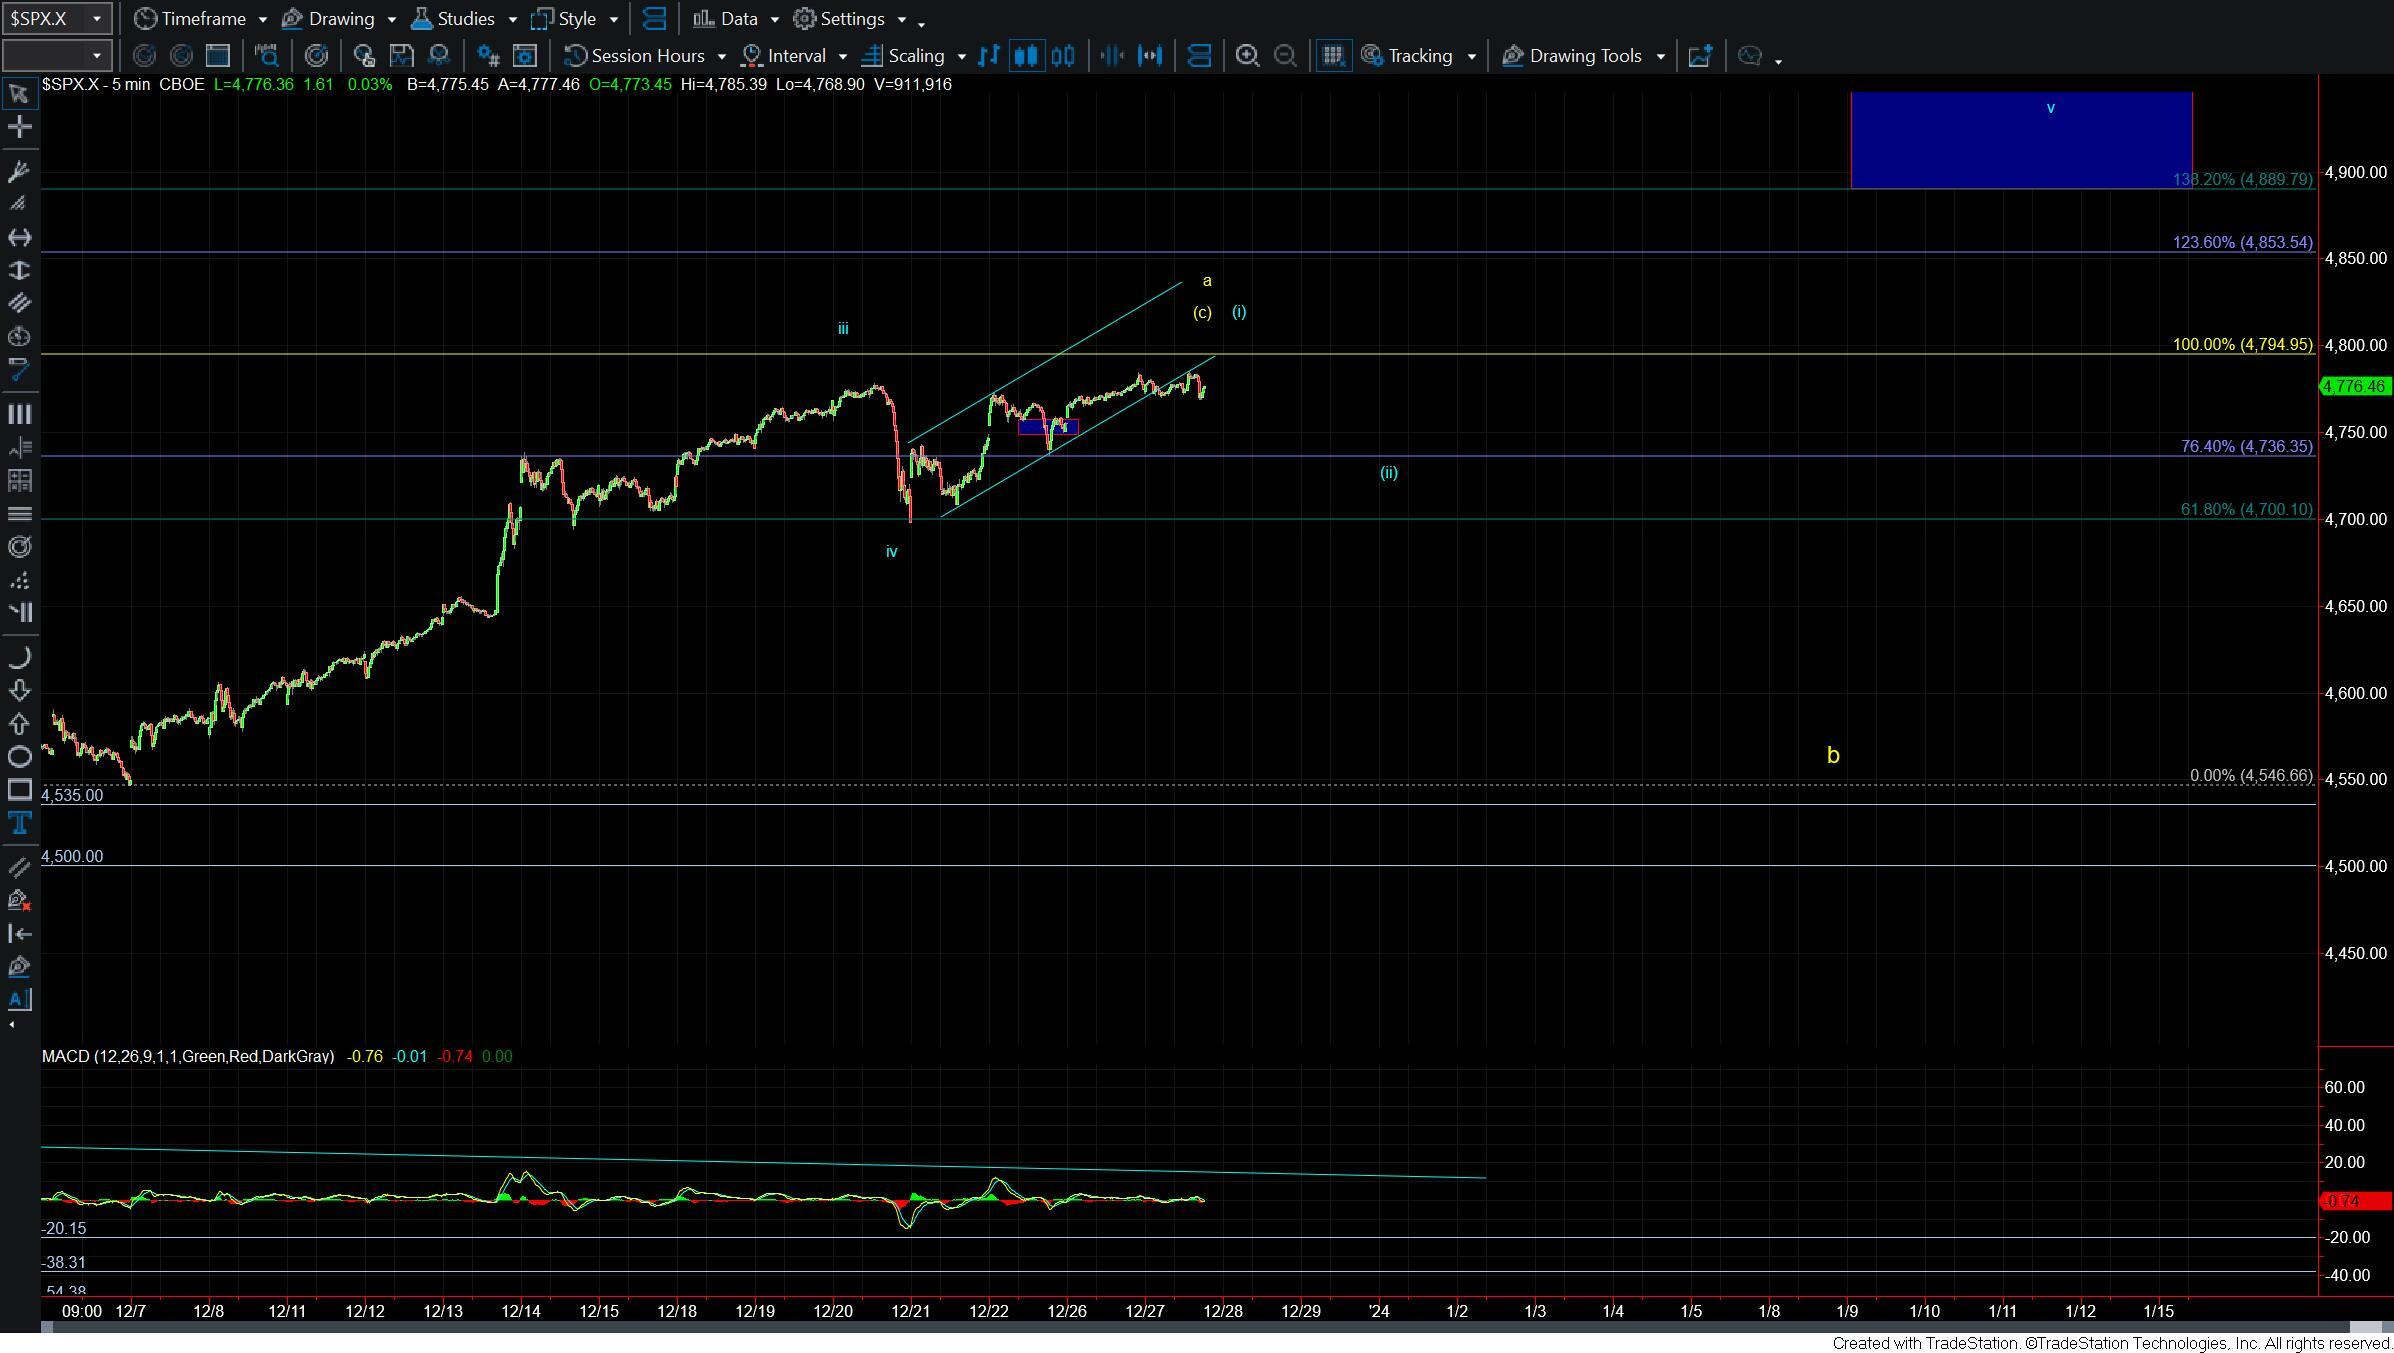
The pivot to keep the most immediately bullish blue count in play remains at the 4695 level and breaking that level would make it more likely that we are indeed following the yellow count. I will note however that the ideal support level for the blue count comes in at the 4751-4716 level on the SPX. So while the 4690 level will remain the pivot should we see a break under the 4716 level the odds of breaking 4690 will increase.
So for now we simply need to wait and watch to see if the market is able to hold both the upper support levels and the 4690 level thus giving us the sign that we may be following the more immediately bullish path toward the 4900+ region or if we are going to see a break of those upper support levels and take a more indirect path as laid out per the yellow count.