Market Consolidating Over Support
 By
By
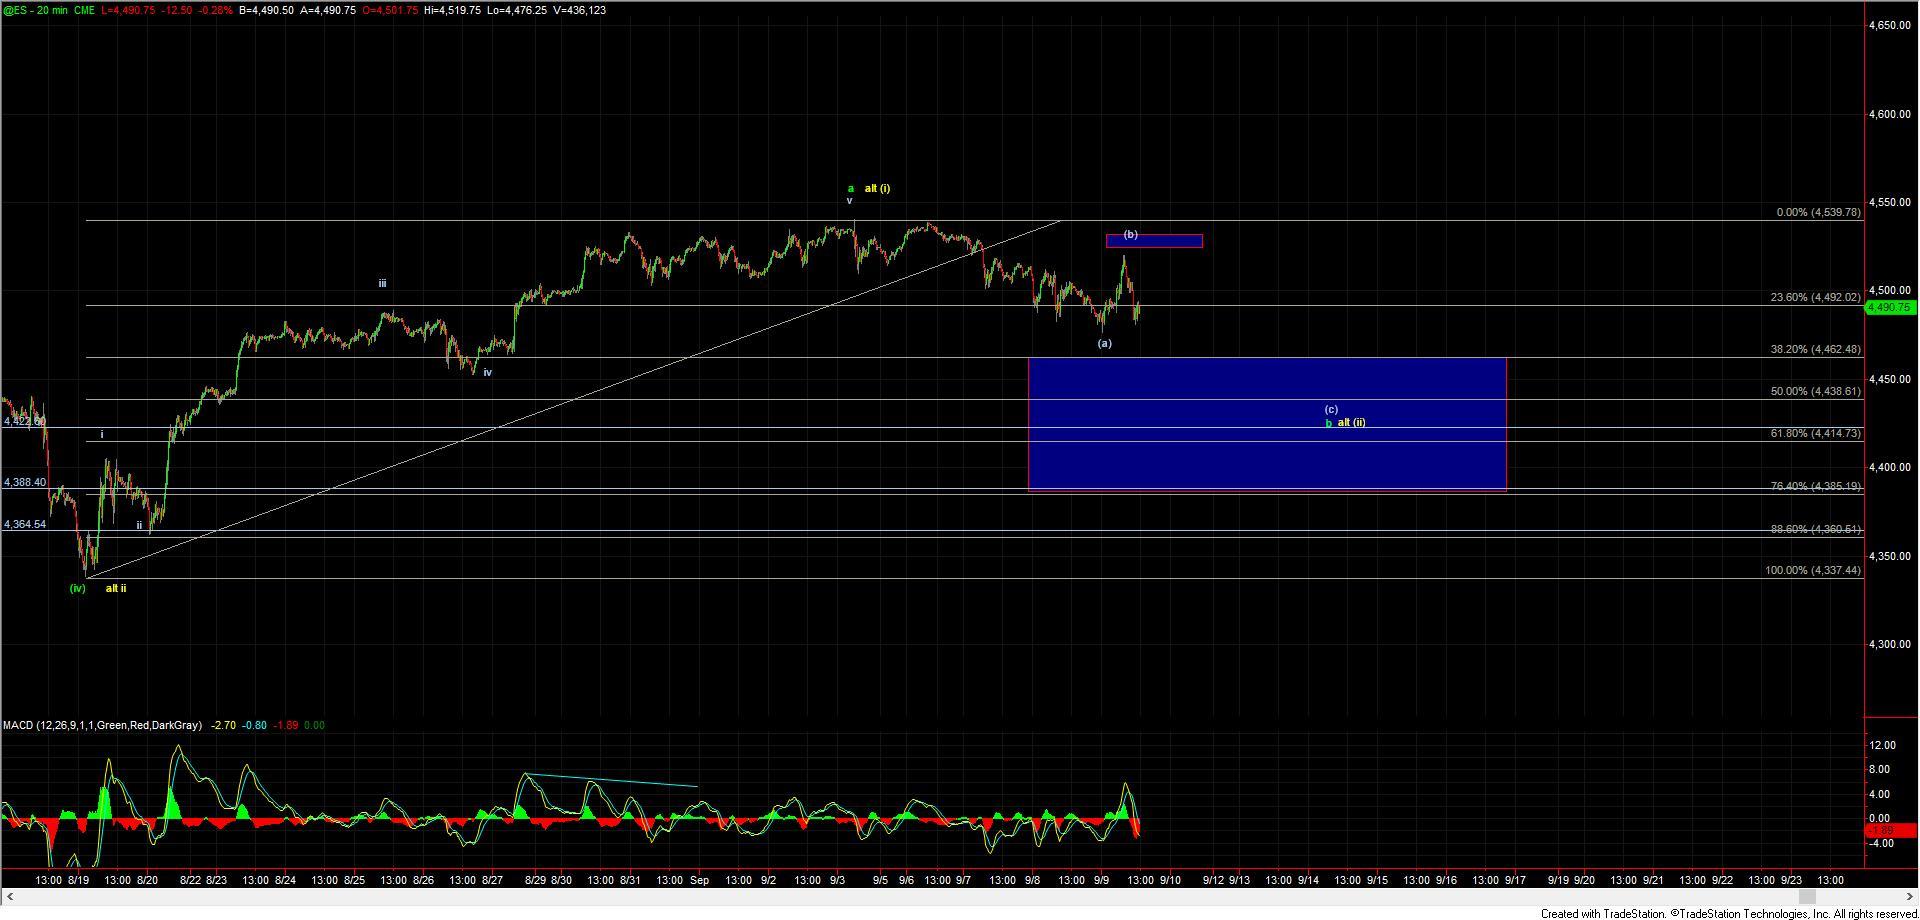
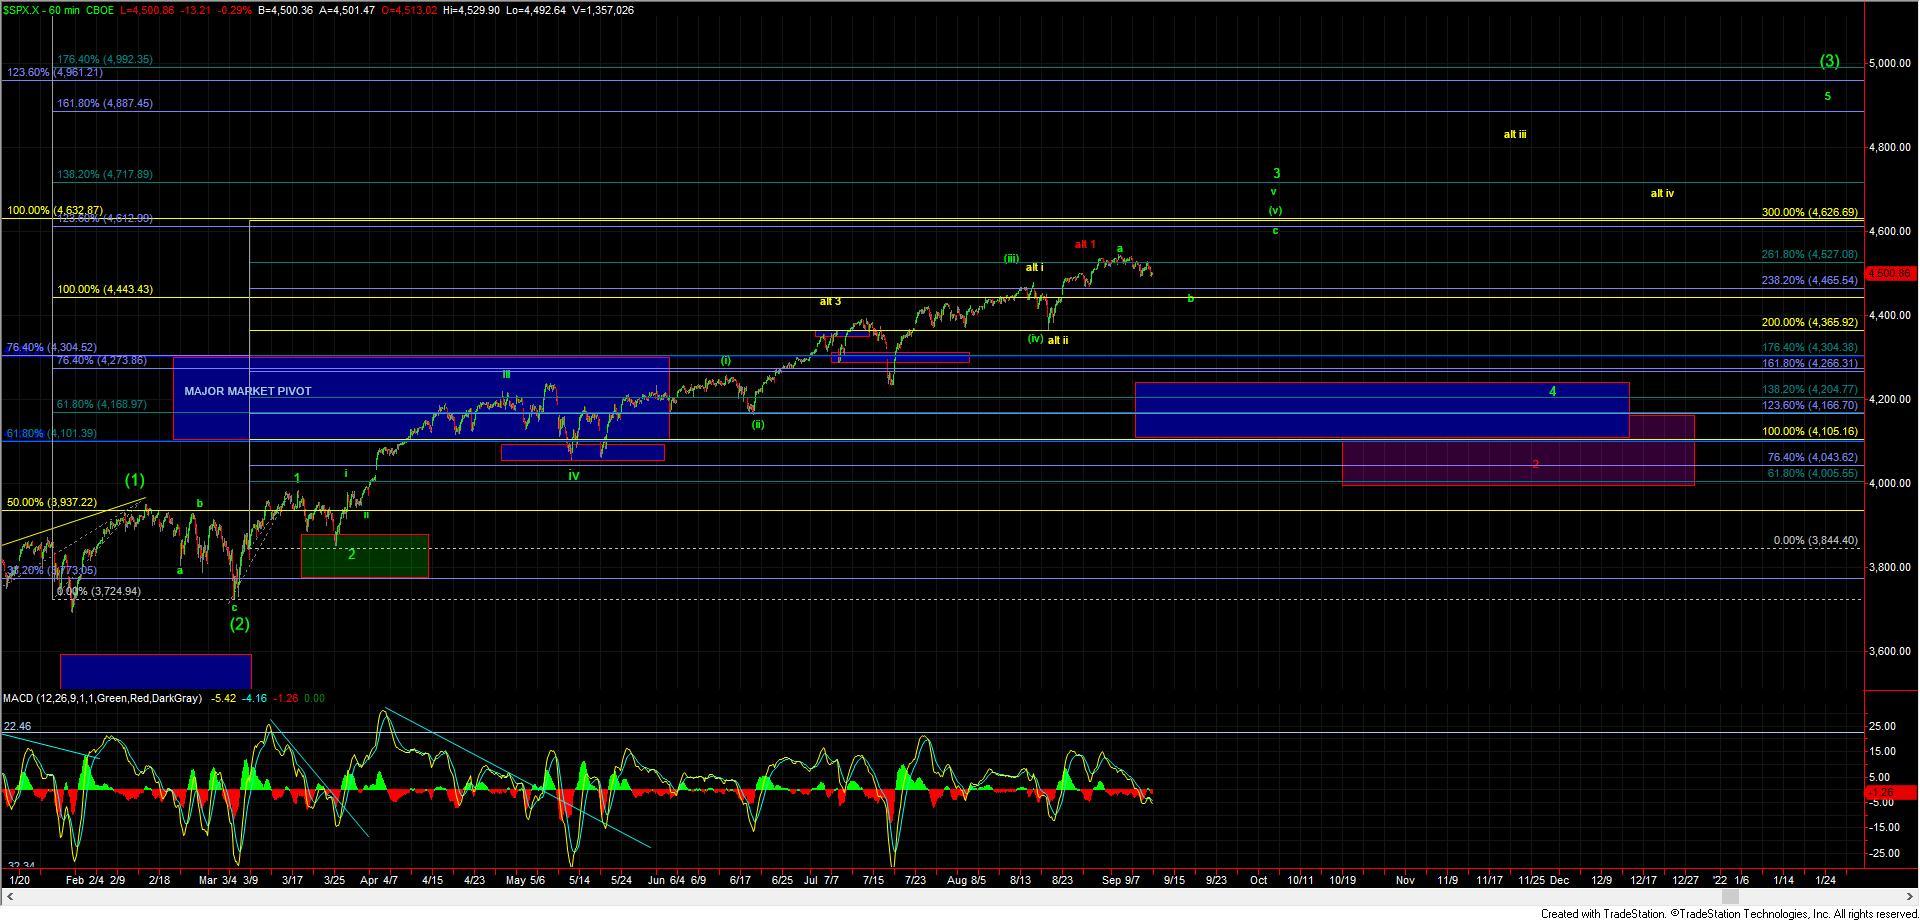
After pushing higher to new highs last week we have seen the market pullback on what is so far a fairly clear corrective wave pattern. This pullback occurred after getting a fairly clear five-wave move up off of the 8/18 low. As we are still counting the pattern as incomplete into the highs last week along with what does look to be a corrective move to the downside the base case remains that this move down off of the highs is simply a pullback that still should resolve higher as long as we can hold support. That support zone current comes in at the 4462-4385 zone below which represents the 38.2-76.4 retrace zone of the wave b / (ii).
The initial signal of a bottom of that wave b / (ii) would come with a full five up from within that support zone with confirmation coming with a break back over the 4539 high. If and when we do break that high then we can layout the upside parameters to help give us further guidance as to whether we may be following the green or the yellow counts. I would however initially be looking for targets in the 100ext of the initial move up off of the 8/18 low for the green count with a sustained breakthrough that level being an early signal that we may be following through under the yellow count.
For now, however, and as noted this morning the key is to hold the support zone noted and to simply watch for that five up off of the lows to give us the initial signal that a bottom has indeed been struck. Unless and until that occurs we may very well see a few more days of sloppy corrective action while the market digests the push to new highs that were seen last week.