Market Closing In On Key Resistance Level
 By
By
After finding a bottom yesterday and moving higher into the close, we saw the market pull back in a corrective fashion overnight, only to push higher again today. We are now closing in on a key resistance level just overhead, which should help provide further guidance as to whether this market has enough momentum to make a direct push back toward the all-time highs, or whether we still need to see additional downside price action in the days and weeks ahead.
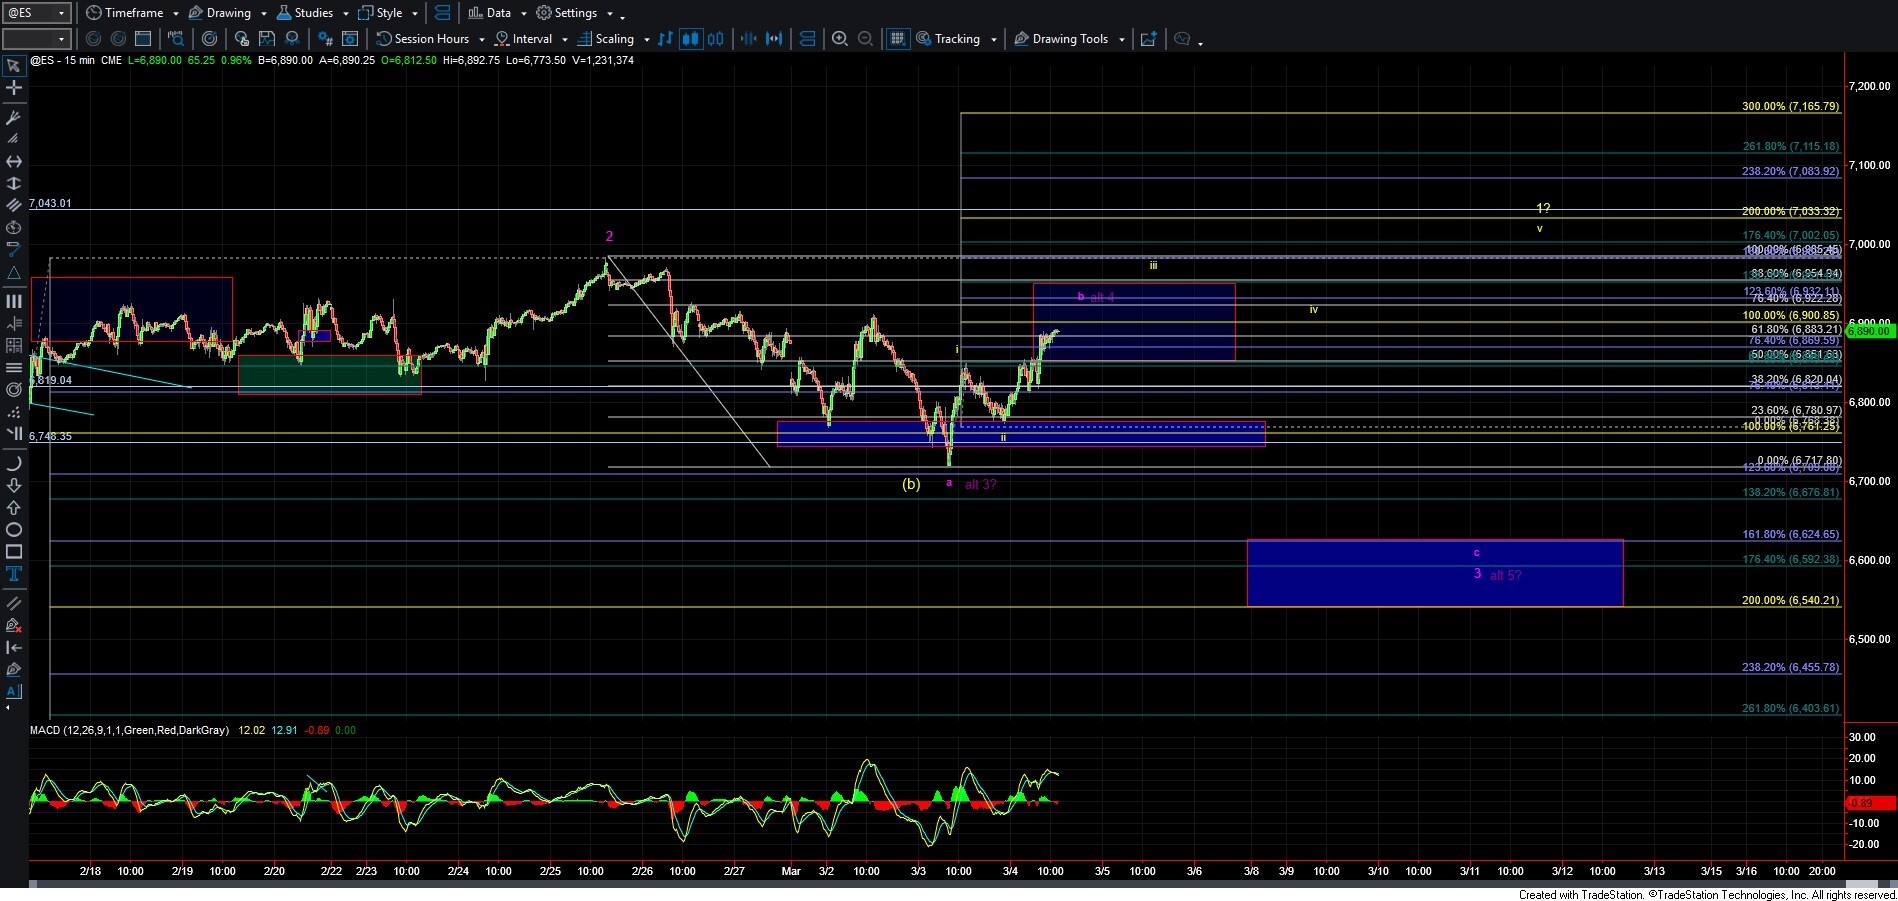
As shown on the ES chart, I am tracking the same two counts that Avi has laid out in purple and yellow, with the yellow count potentially taking us back to new highs and the purple count suggesting another move lower before finding even a local bottom. I will note that both of these counts are far from clean, which continues to make it difficult to track and to say with a high degree of certainty which path the market is more likely to follow. For now, I will continue watching how the price reacts at key resistance levels overhead and support/pivot levels below to help guide us in the days ahead.
The yellow count suggests we may have bottomed in a wave (b) and are attempting to develop five waves up that could ultimately push us back to new all-time highs. At the moment, however, we do not yet have five waves up off the low and are currently sitting just under the 100% extension of the initial move off the low, which comes in near the 6900 level. If we are able to push through that level and then move into the 6954–7002 region for a wave iii, followed by a pullback for wave iv and one more push higher for wave v, it would provide initial confirmation that we have indeed bottomed in this yellow wave (b) and could see higher levels into the spring.
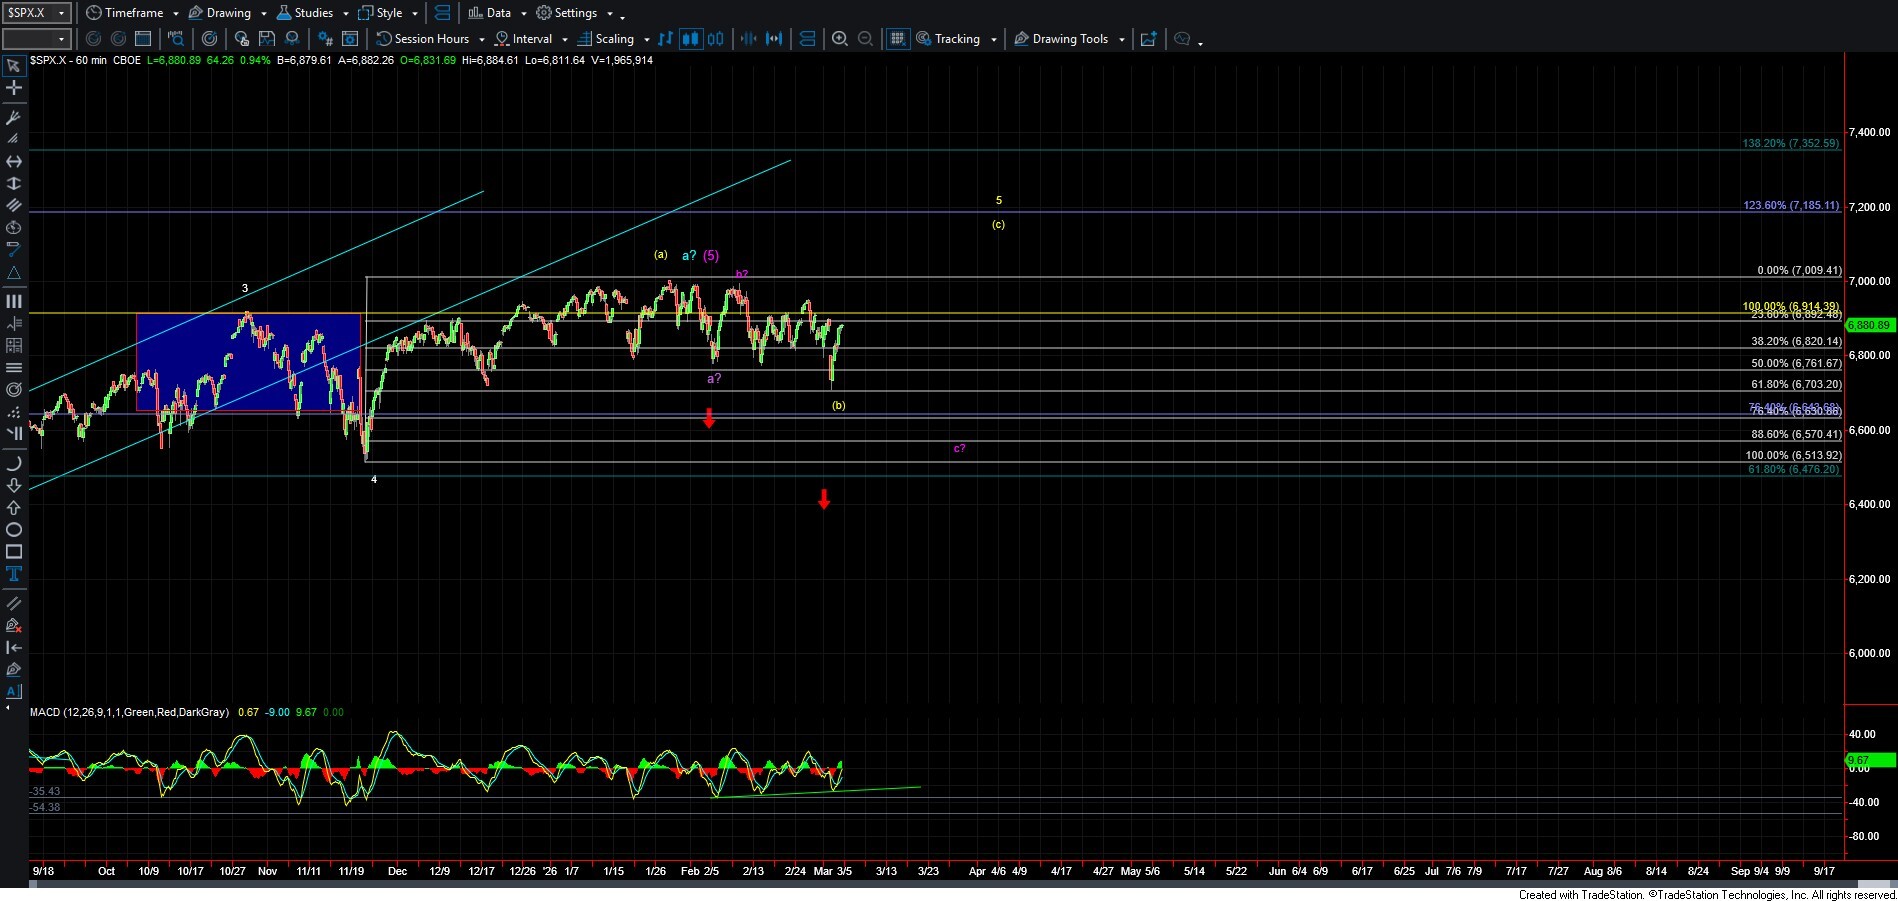
While there are several issues with this count, I do want to note that we have now formed a nice positive divergence on the MACD on the 60-minute chart, and we also bounced right off the 61.8% retrace of the potential wave (a). These factors are providing some larger-degree support for the yellow count. To keep this potential impulsive path intact, I would want to see the price hold over the 6810 level. A break below that level would serve as an early warning sign that we may not see direct upside follow-through under this scenario.
The purple count, on the other hand, suggests that we still have lower levels to go before we find even a local bottom. The challenge with this count is that if we do follow through lower, it is likely to take the form of an ending diagonal to finish off the wave c of the initial move down. Where exactly we would sit within that Ending Diagonal is still not entirely clear. It is possible that we may need only one more lower low to complete the structure, though a series of additional lows could also develop before the pattern is complete.
I have outlined both possibilities on the ES chart, but for now, I will adopt the scenario suggesting we are working on a wave b of 3, shown in bright purple on the chart. If we do move lower, however, I will remain very cognizant of the fact that technically the Ending Diagonal could be considered complete with just one more lower low, which could then result in a sharp move higher. We would need to see a break back under the 6819 level, followed by a break under the 6761 level, to provide initial confirmation that we are following this purple count lower, with final confirmation coming on a break under the 6717 low.
With the wave structure on both sides of this market remaining quite sloppy, I am personally content to sit tight and wait for a clearer setup to develop before putting short-term capital at risk, while still remaining very aware of where this market stands on the larger time frames.