Market Closing In On A Key Near-Term Resistance Zone
 By
By
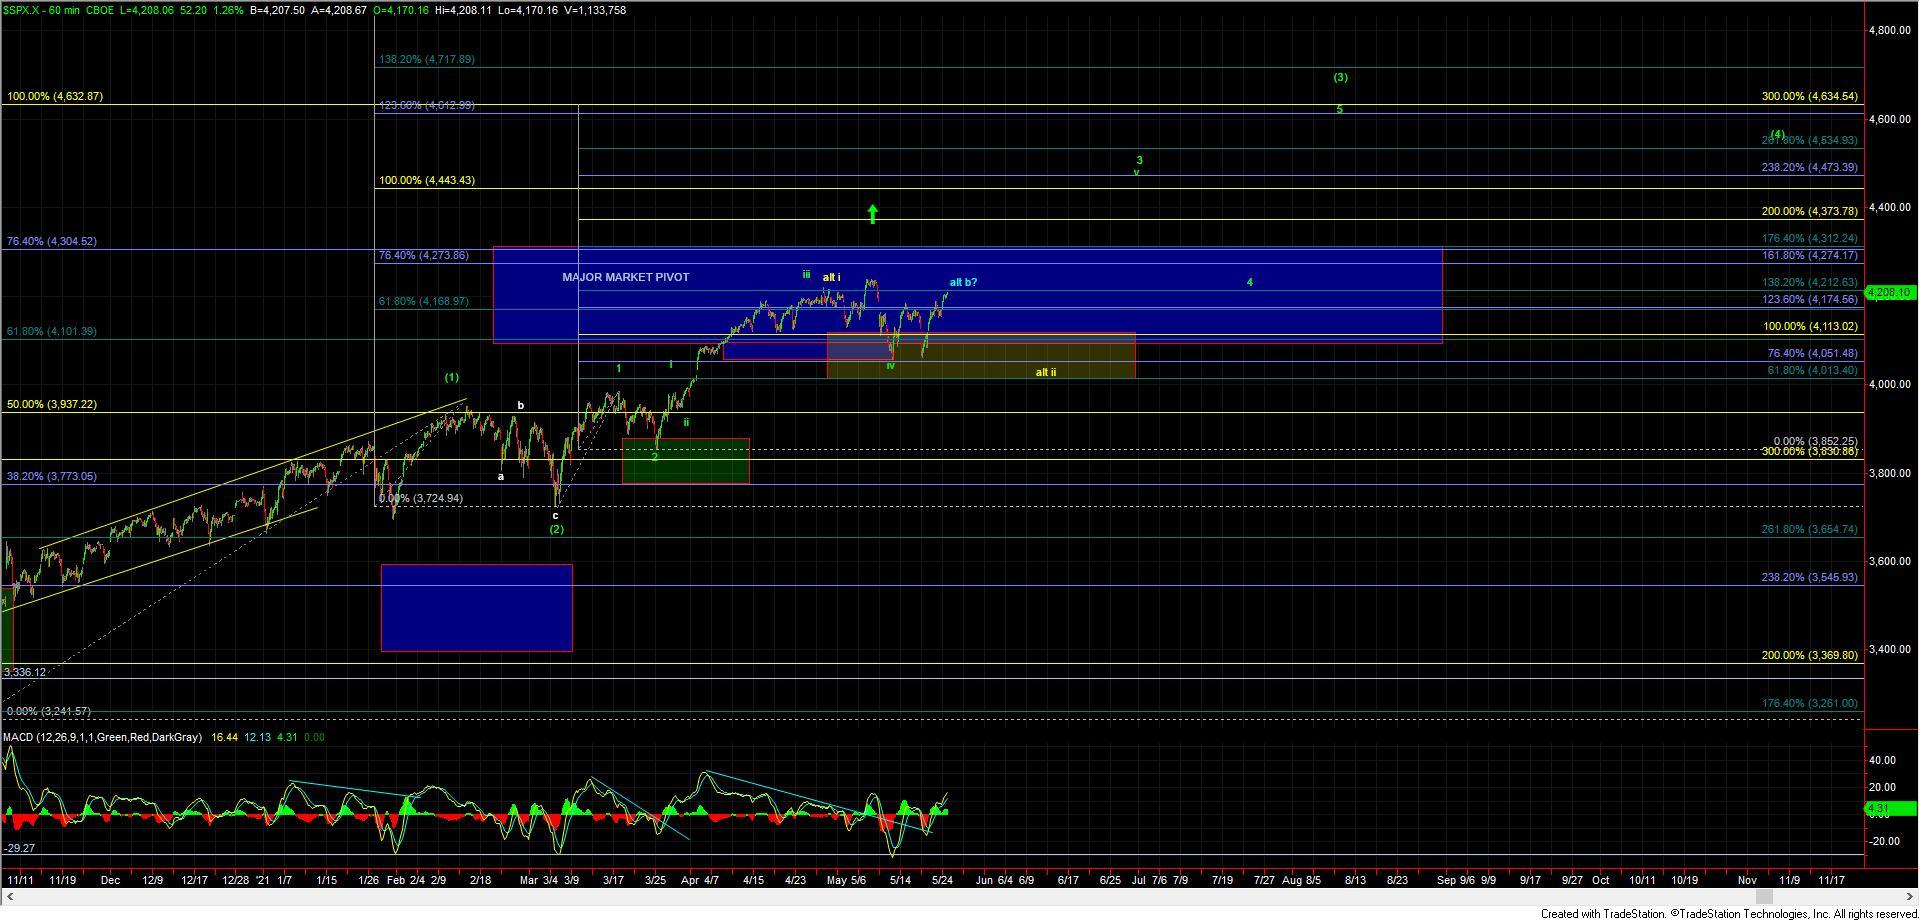
Today the market pushed directly higher which is still very much supportive that we have indeed bottomed in the larger wave iv which we are showing in green on both the ES and SPX charts. Having bottomed in that wave iv puts us in a wave v which should ultimately take us back over the 4240 high and ideally targeting in the upper 4300-lower 4400 range before topping in the wave v of 3 as shown on the SPX chart.
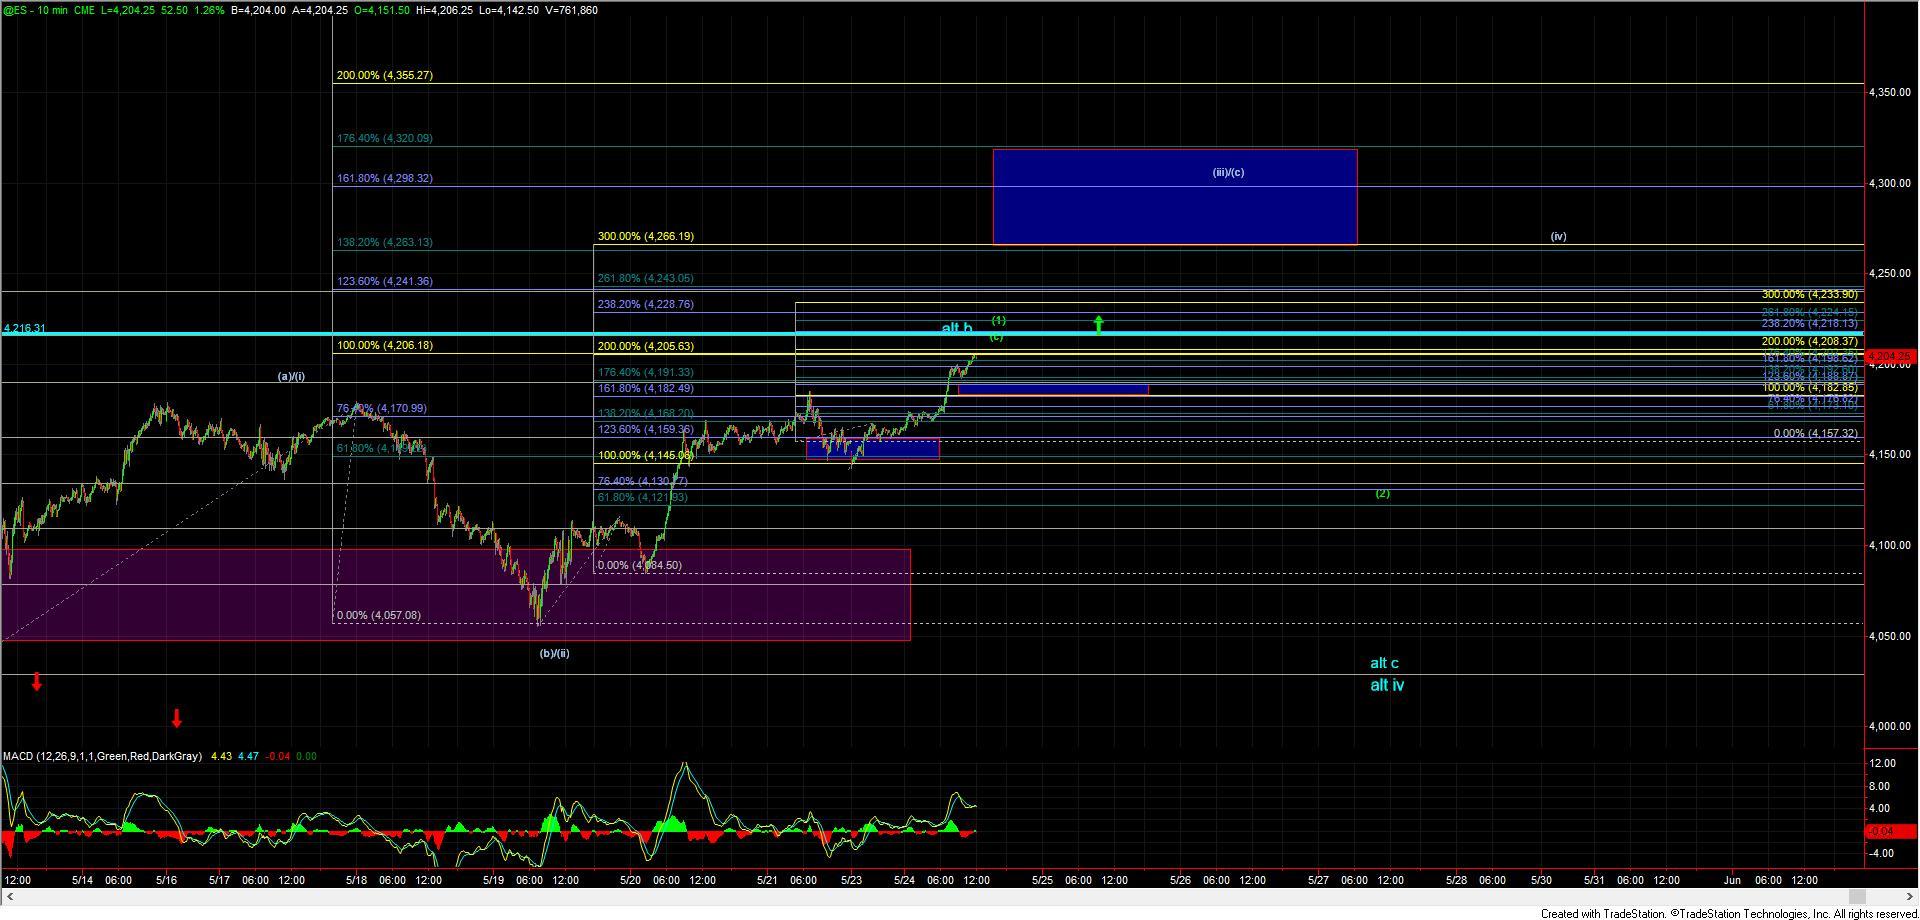
The exact micro path up towards that level is a bit less clear at the moment as we still only have three waves up off of the lows and are at a fairly important inflection point here at the 4205 level on the ES. This 4205 level represents the 100ext of the initial move up off of the lows that were struck at the 4028 level back on May 13th. I am viewing this zone as key in regards to the short-term momentum. If we can see a sustained break of this 4205 level on the ES with follow-through over the 4216 level I think it will open the door to seeing more of a direct move up towards the 4263-4320 zone overhead. While moving up over the 4216 would still not rule out filling out this wave v in a more complex ending diagonal pattern with the potential to still see a local top in the form of a wave (1) as shown in green it would reduce the odds of seeing a top in the blue wave (b) considerably.
If we can continue to push through the 4216 level and move into that 4263-4320 zone then it would open the door for this move up off of the 4028 low to see follow-through in a more standard impulsive wave pattern vs. the more complex ending diagonal. Of course, we still have a lot of work to do before we can confirm this but this be able to push directly into that target zone I still am not going to rule out the impulsive path just yet.
For now, however, the key levels to watch into the EOD, overnight and into tomorrow morning are going to be 4205 and then 4216 on the ES. Support below comes in at the 4182 level with and then the 4157 level. Moving below those levels would be an initial signal that we may have topped in either the wave (1) in green or the wave b in blue. The structure of the move down off of the highs upon a break of support should help give us guidance as to which path we are following should we see a failure near current levels. A full five down off of the highs opens the door to the blue path whereas a clearly corrective move lower is more supportive of a retrace per the green wave (2).