Market Clarified A Lot Today
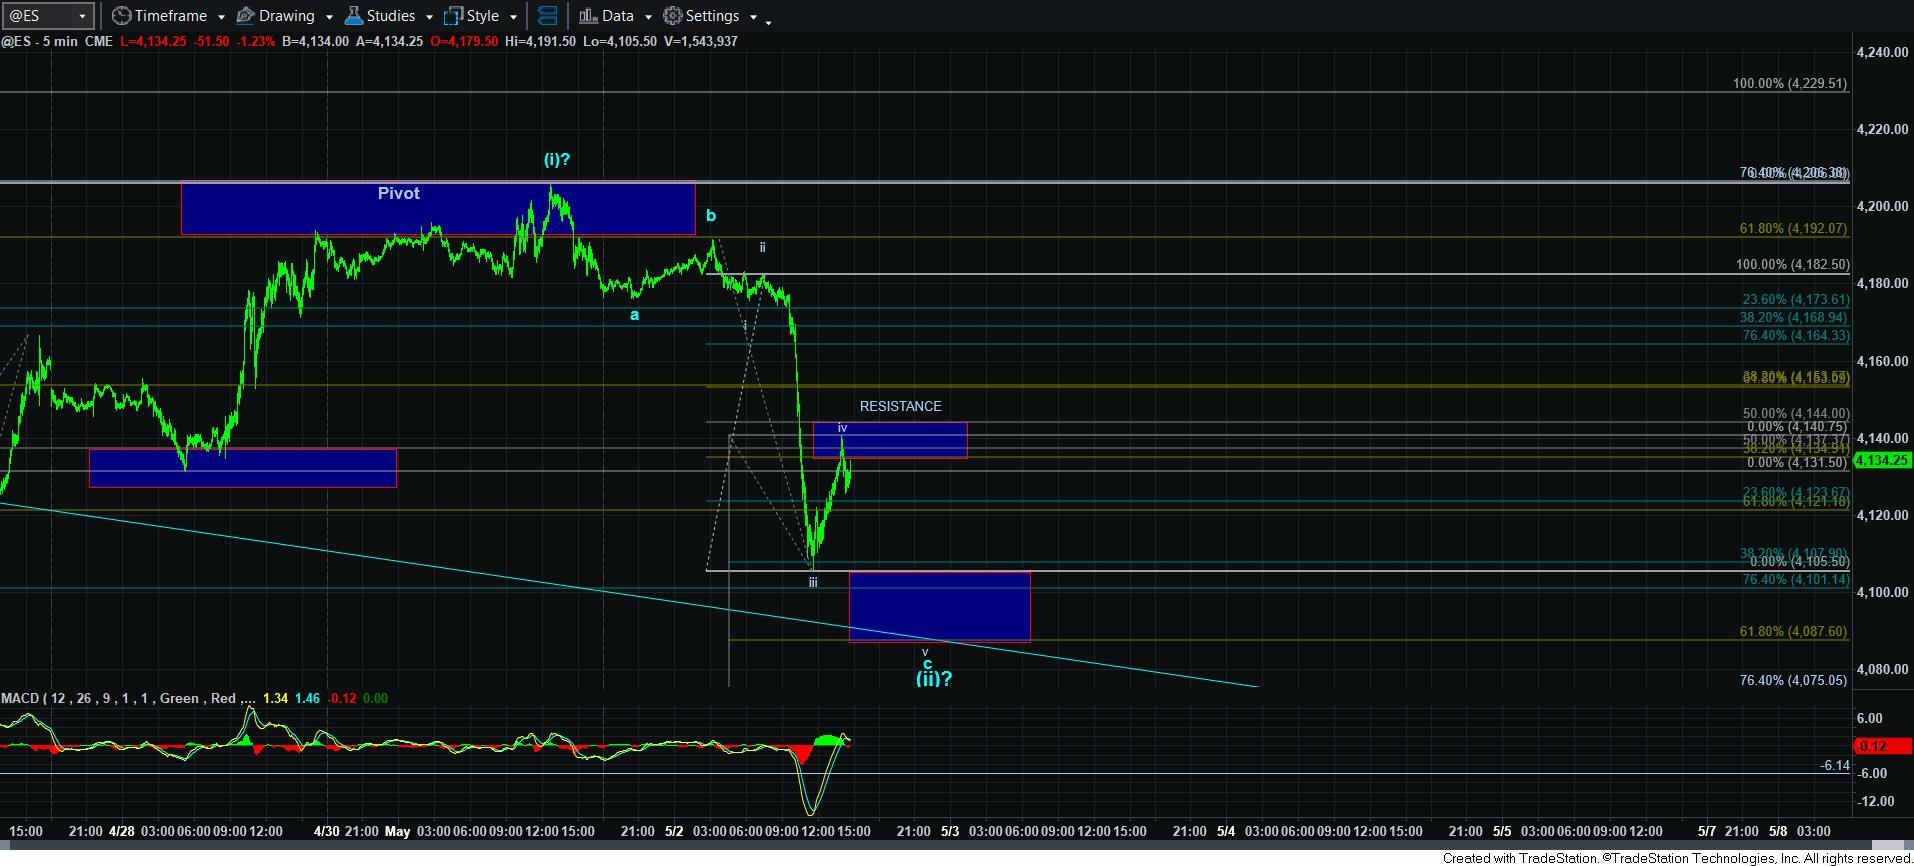
With the market pushing on the pivot as hard it possibly could for us to retain the potential [i]][ii] structure, we actually topped EXACTLY at the top of the pivot at the 4206ES level and turned down quite hard today.
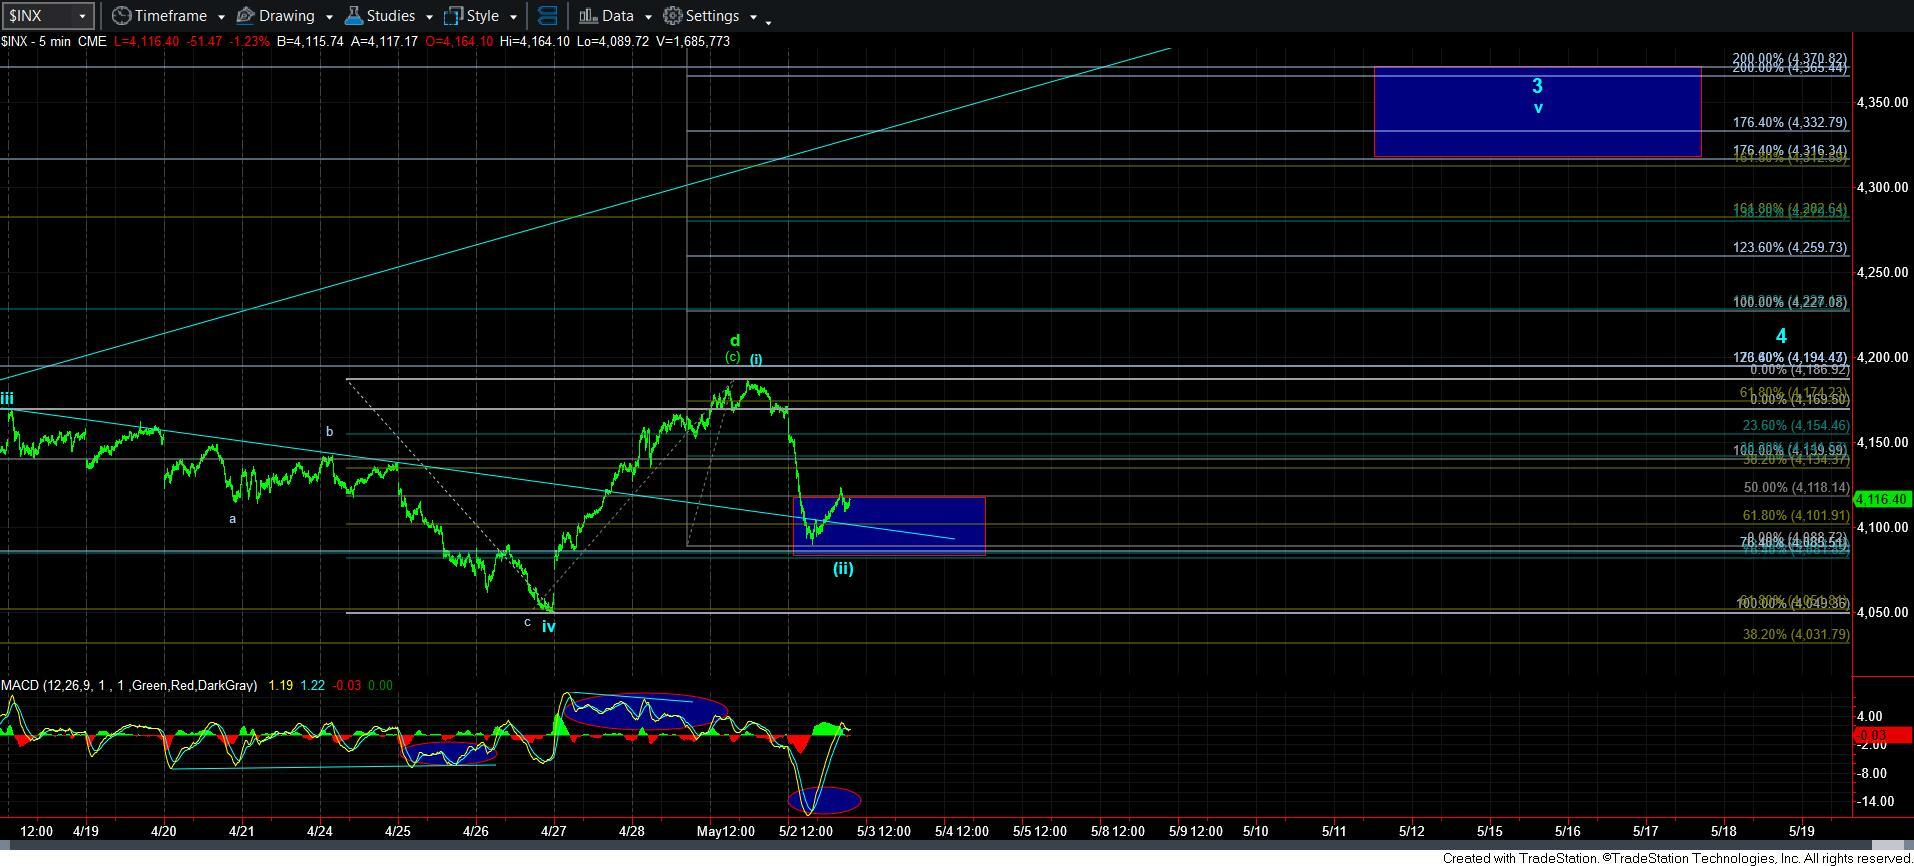
As I mentioned in our live video this morning, if we were going to get the [i][ii] to play out, then wave [ii] was likely going to be a deep retrace. You see, when you analyze a wave structure, it is not just the particular structure upon which you have to focus. The degree upon which you are focusing is important, but you also have to understand how it fits into the bigger picture, and higher degrees.
Since we have an ideal target for a 3rd wave which generally targets the 1.618 extension of waves 1-2, and sometimes it pushes to the 1.764-2.00 extension if it is a strong move, we would need a deep wave (ii) to provide us with a 5-wave structure in which the projection for waves [i][ii] also fit the targets for wave v of 3 in the larger degree. And, again, a deep retracement for wave [ii] does that job., as you can see from the attached 5-minute SPX chart.
But, as I write this update, I am unsure if we have one more lower low to complete the c-wave of wave [ii] or not. But, as long as the intra-day high holds, as shown on the ES chart, then I can expect a lower low. However, if we break back out over the intra-day high, then we could count 5 waves up off the low and potentially have a bottom in place for wave [ii].
I have noted a lower box on the 5-minute ES chart with the ideal support for wave v of the c-wave of wave [ii]. The maximum I would allow is 4087ES, which is where the 5th wave is equal to .618 the size of waves i-iii. And, when you have an extended wave iii, as we have here, then I would not expect us to exceed that ratio for a 5th wave. So, please use that as your ideal support right now.
To be honest, I really do like this set up right now. We have our support outlined below and it gives us a very defined risk profile for anyone who chooses to take the long trade here.
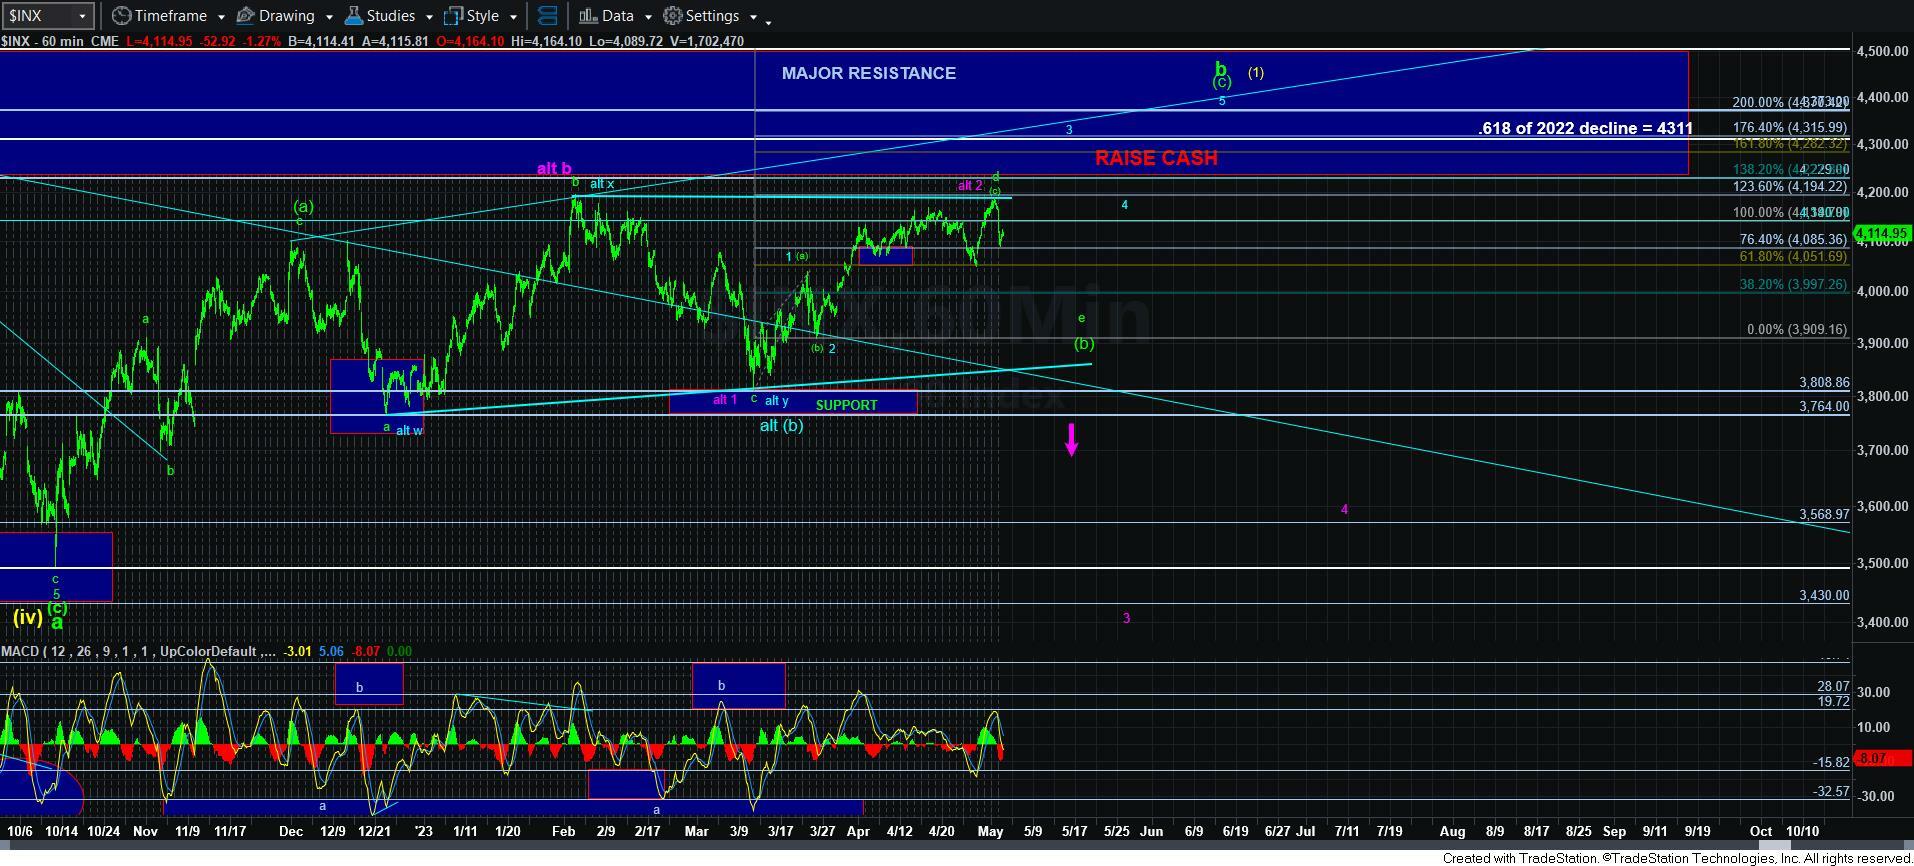
Furthermore, wherever the market finds a bottom down here, and then begins to rally, that low is going to be of UTMOST importance in retaining a view of an immediate rally to 4300+. You see, if we rally through the resistance noted on the 5-minute ES chart, and then break back below that low, that opens the door to a c-wave in the e-wave of the [b] wave triangle. And, for various reasons I am not going to outline right now, I am not as confident in that count anymore. So, a break-down as I just described could open the door to top being in place, yet I will be tracking the triangle count primarily.
For now, we are seeking an impulsive move off any low we strike when this decline bottoms. That will be an initial signal that we are ready to attack the 4300SPX region. That is going to be our next signal in the coming days.
We have been given very nice parameters by the wave action. Let’s take them into account into making our decisions.


