Market Cannot Seem To Find Its Footing
 By
Avi Gilburt
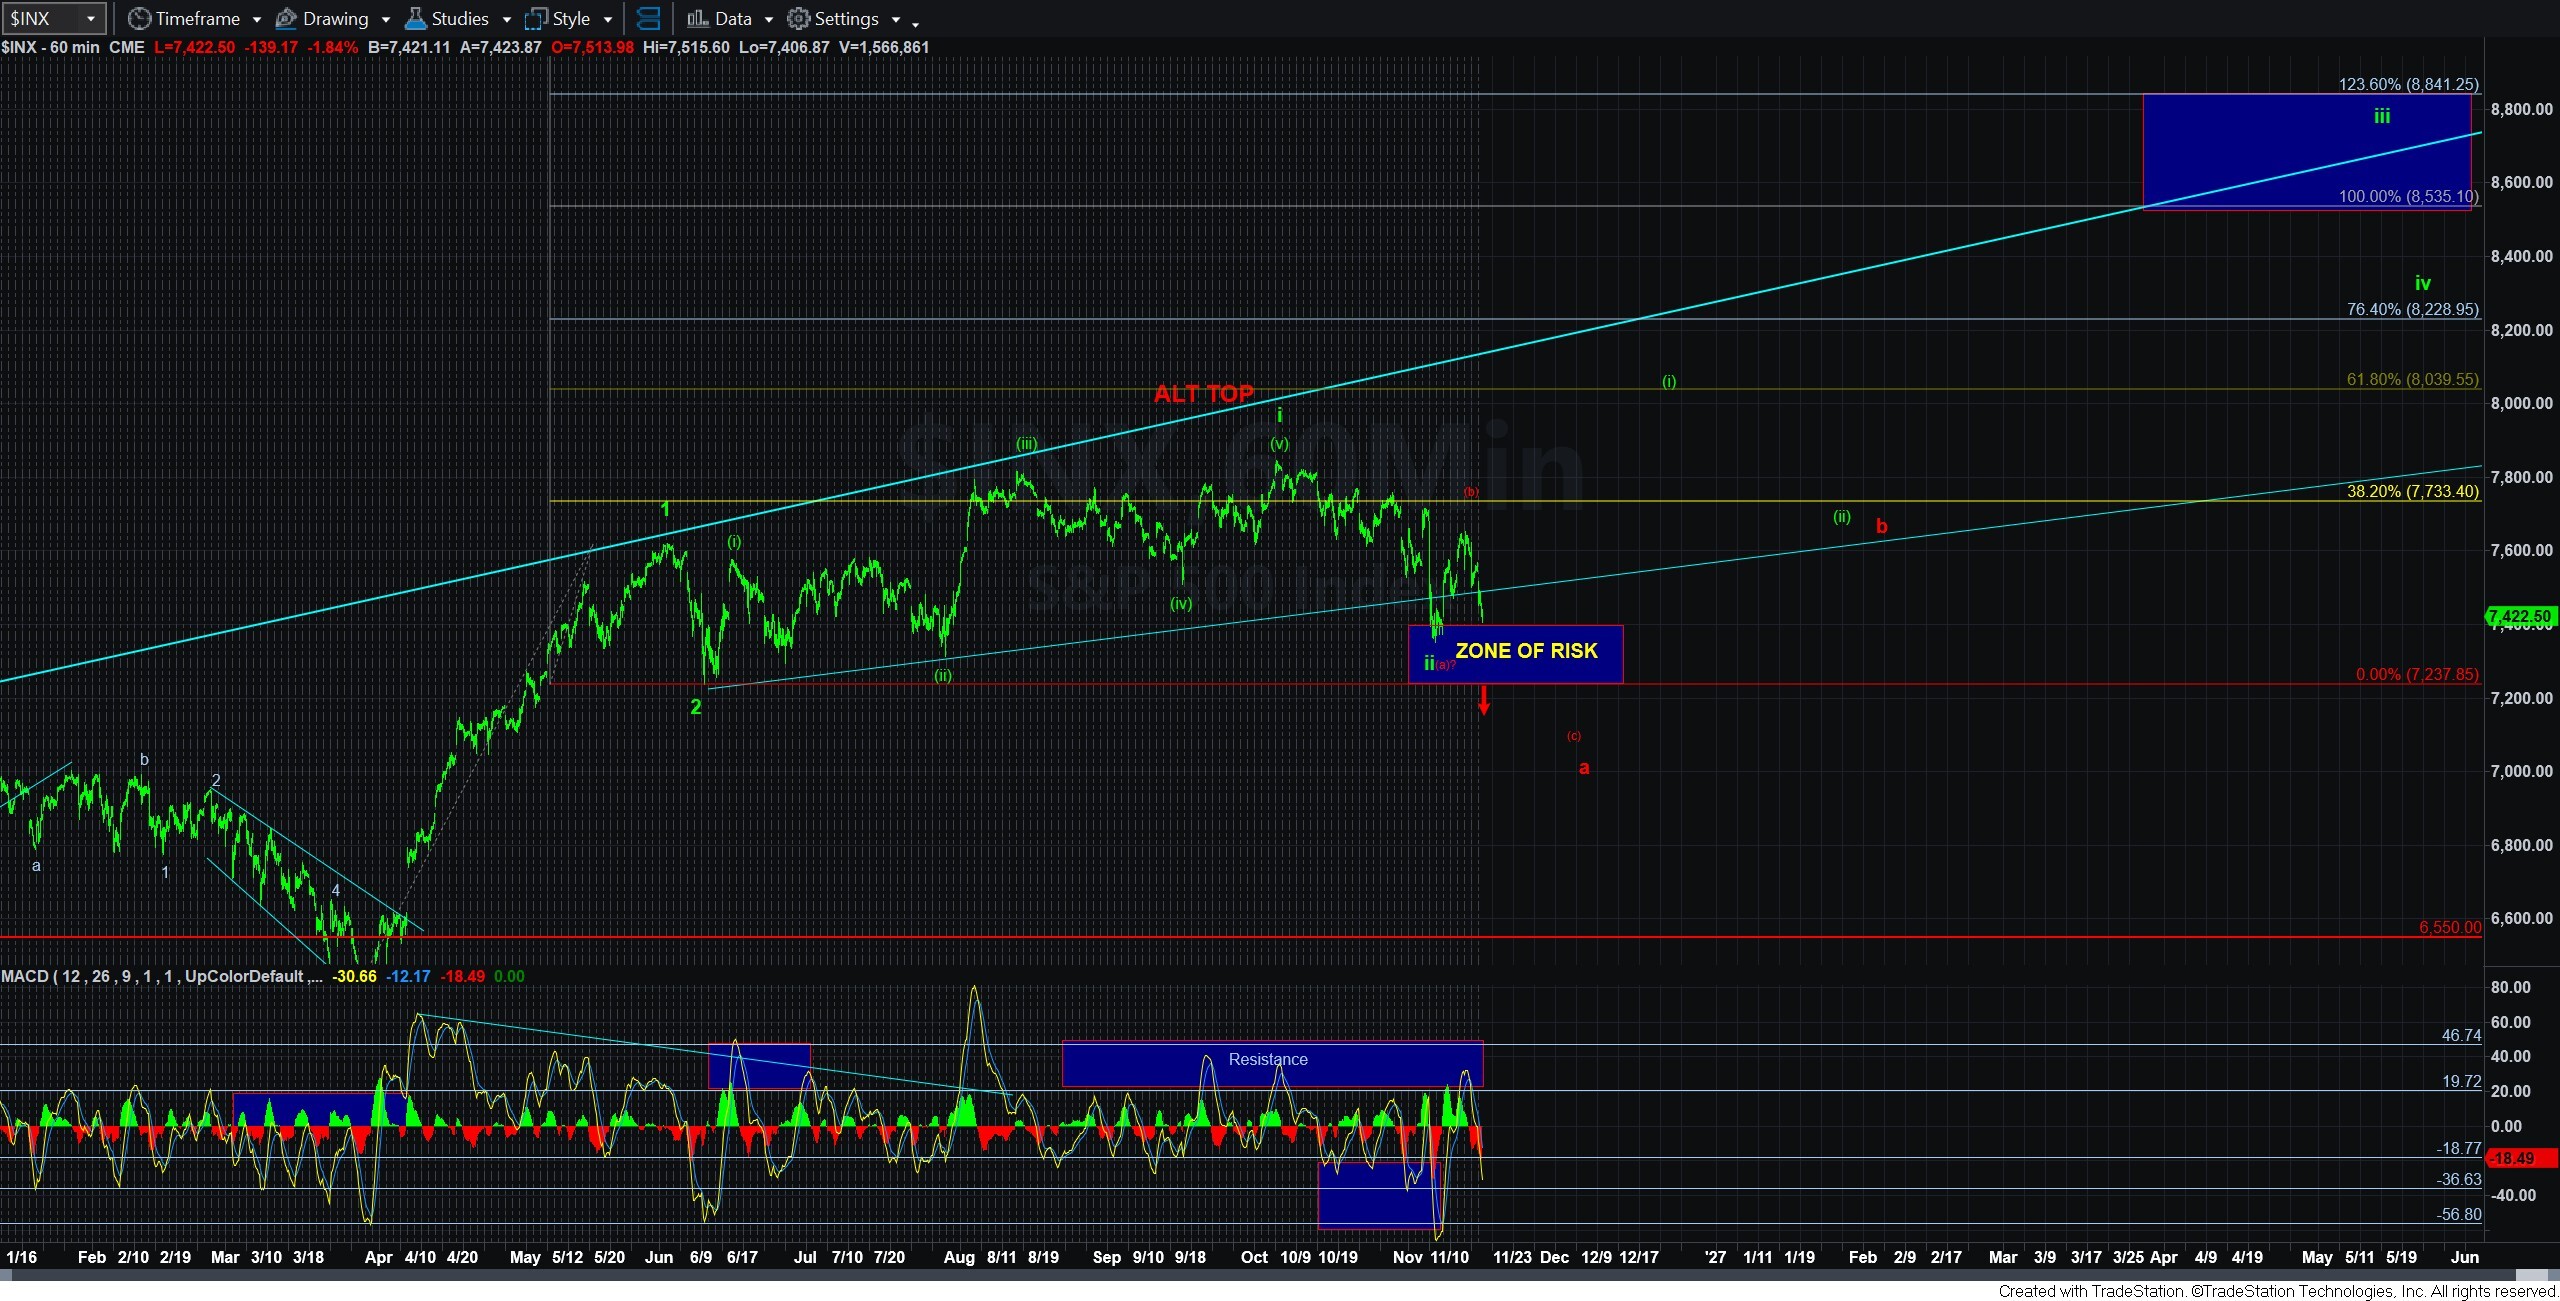
As outlined in the weekend update, the market is going to have to prove the green count to us to suggest it has bullish intentions going into 2027. And, until that happens, I remain quite skeptical of this potential. So, this still leaves us primarily looking for a potential downside set up.
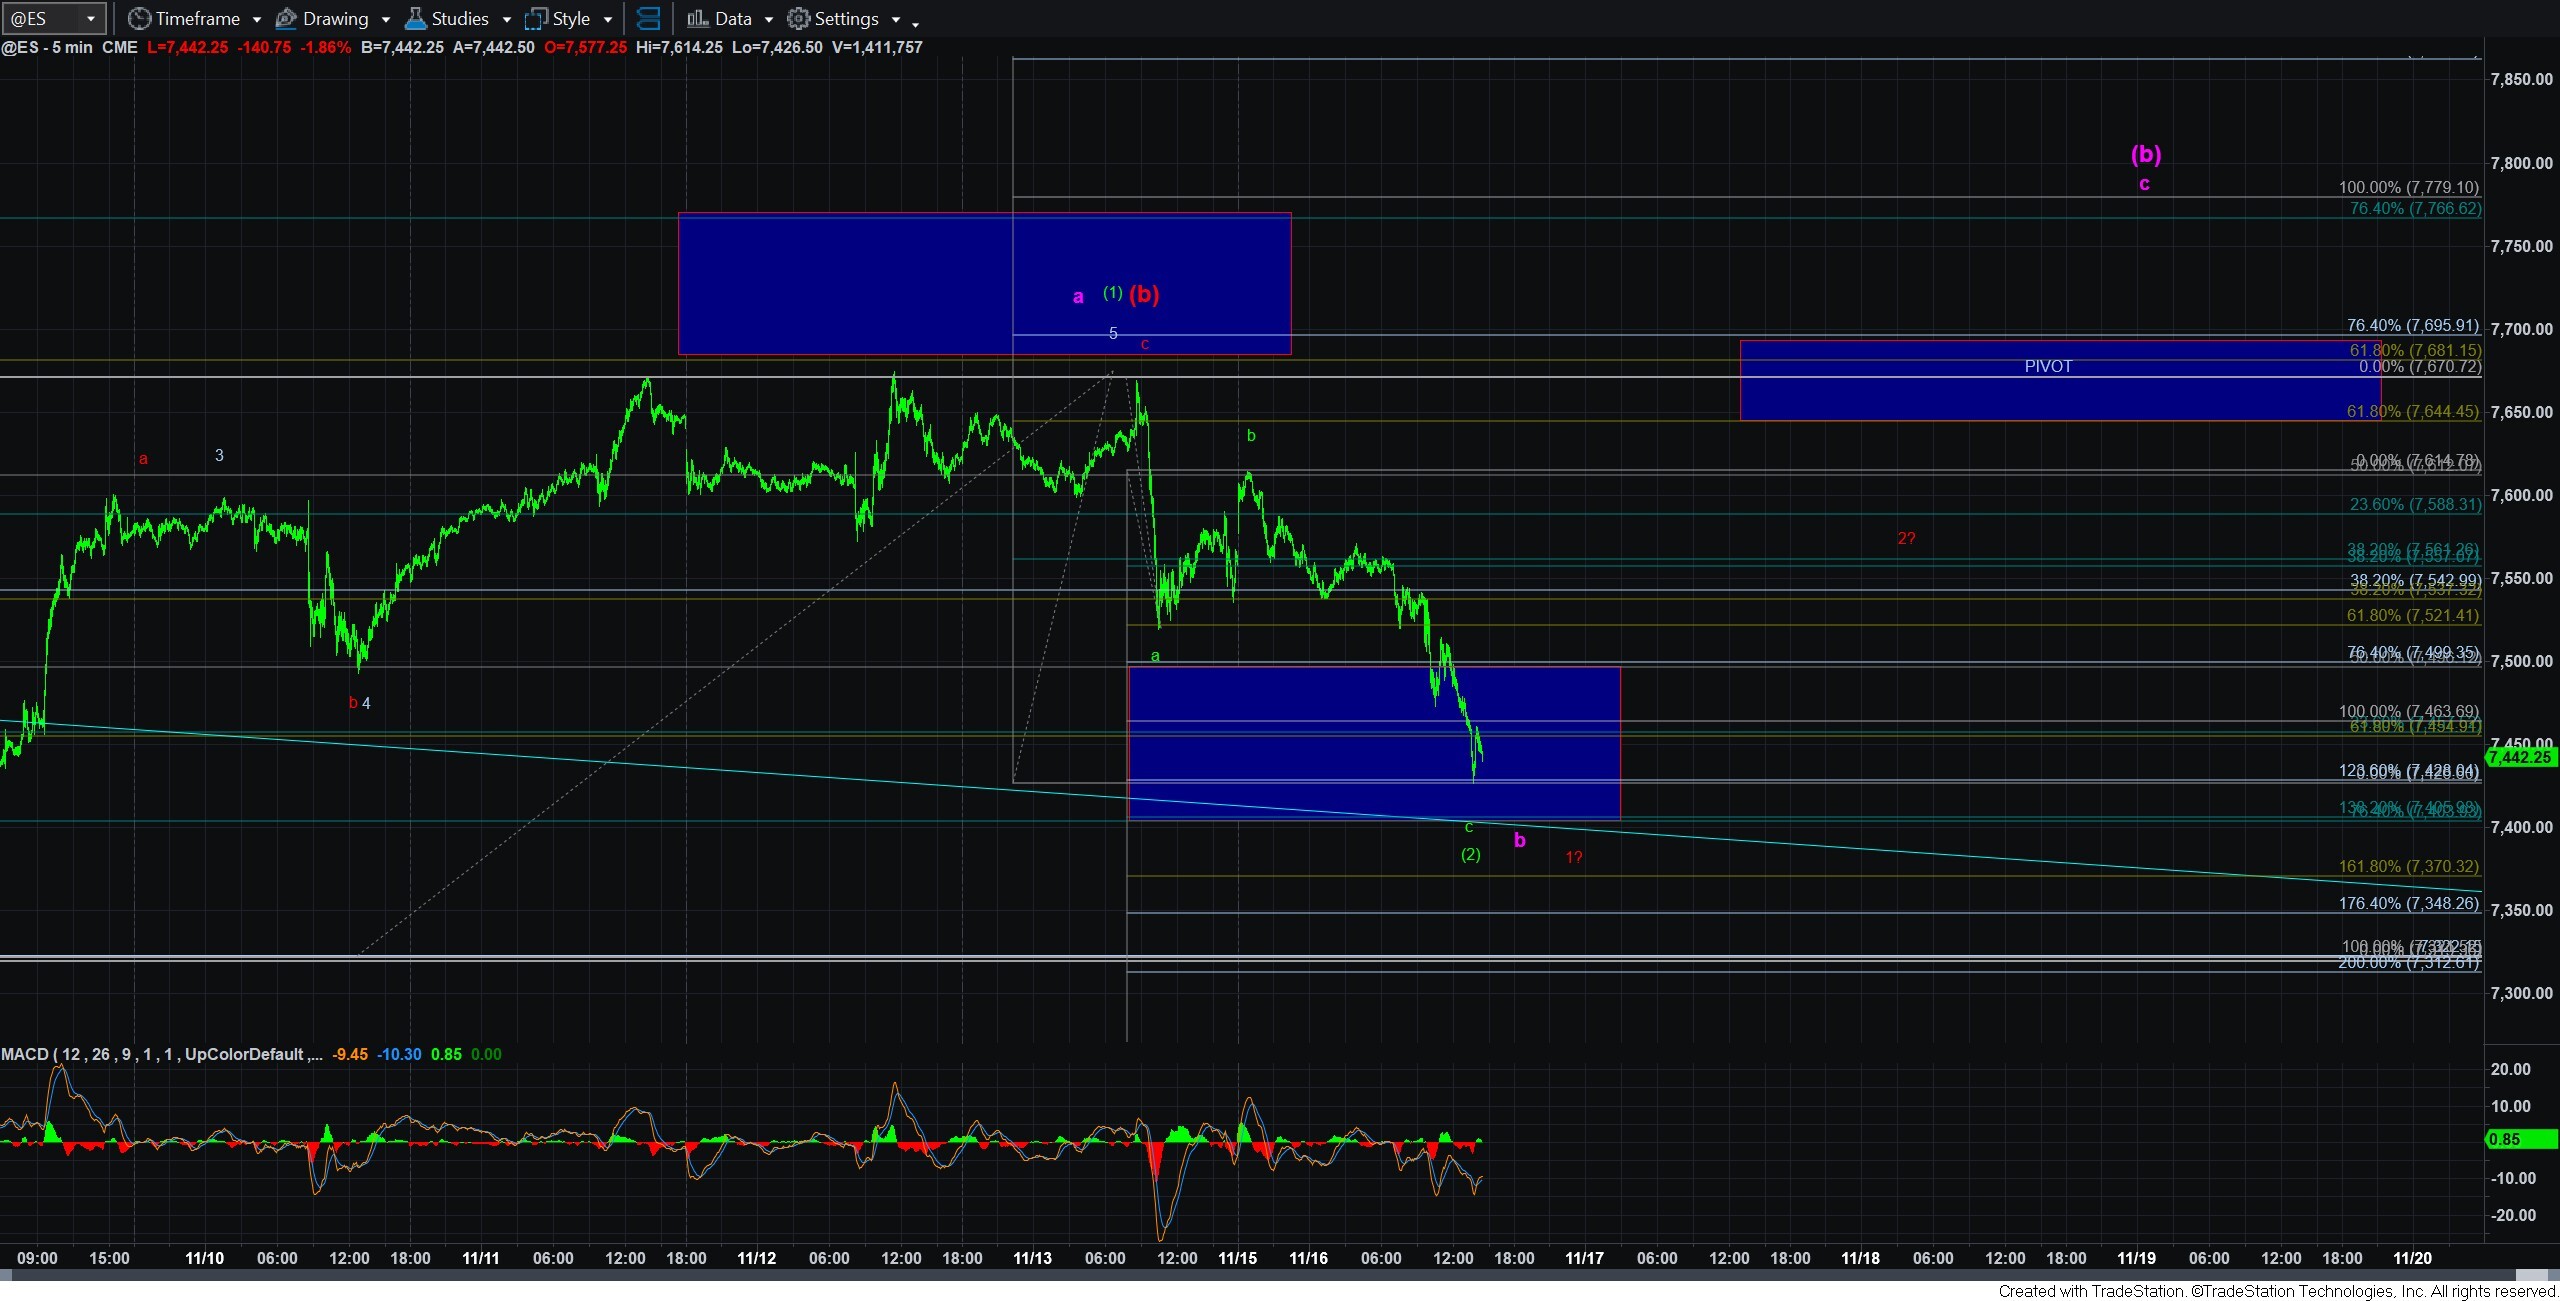
Yet, I cannot say that one is very clear. While the ES/SPX did top at the .618 retracement of the prior decline this past week, I cannot say that the decline on Friday was a CLEAR 5-wave structure which would suggest that the red (c) wave is in progress. Of course, it is certainly possible that it has begun to the downside. But without a clear structure for that set up, I have a hard time outlining a potential shorting opportunity for it. Thus far, the decline seems to be a segment of 3-wave structures.
This leaves us without a really good count for the red path. But, as long as all bounces remain corrective we could be dropping in a diagonal whether it be an ending diagonal for the (c) wave, or just a leading diagonal for wave 1 of that c-wave. Unfortunately, the downside structure is not clear enough to provide specific guidance to that regard.
But, as I noted in my updates today, as long as all bounces remain corrective, then pressure will remain down.
The reason I say that is that the other paths I outlined over the weekend – the purple and green paths – both should see an initial 5-wave rally off a low, since both those structures are traditionally and most commonly standard 5-wave structures.
To remind you, should we begin a 5-wave structure off a low, that can be the c-wave of a bigger (b) wave in purple, and it can also be the start of wave (3) in the green count.
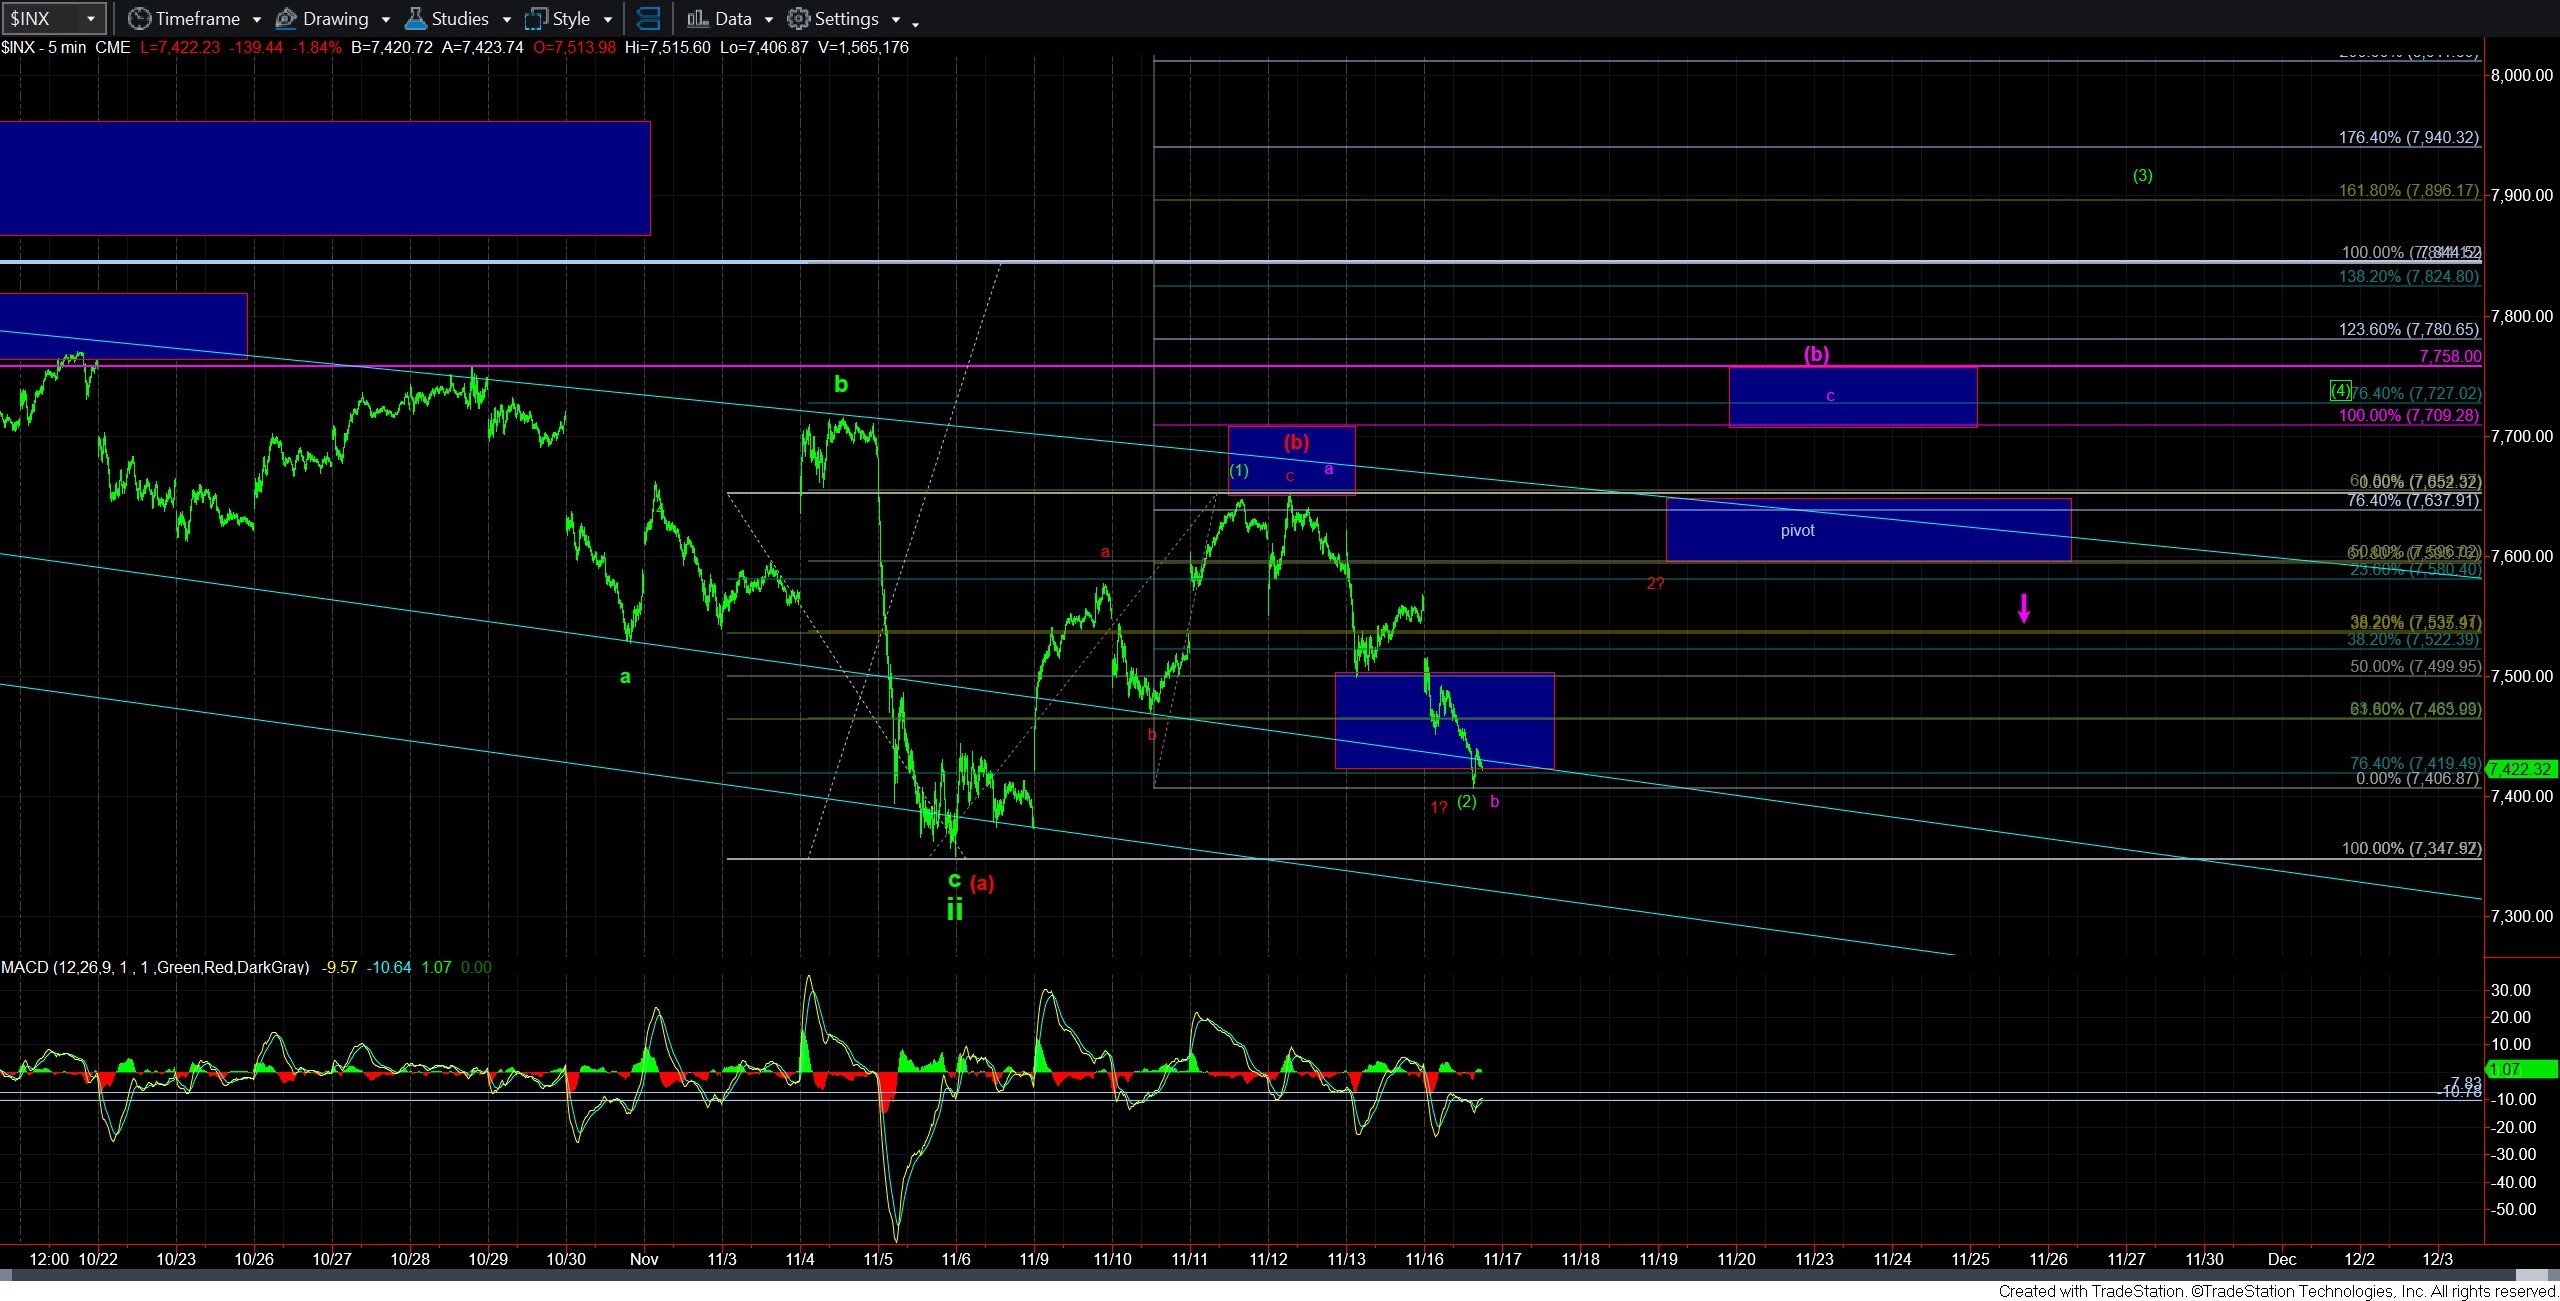
Let’s discuss what the market will have to overcome before we can consider the green count. And, that is the purple count. The purple count would be seeking an initial 5-wave rally off a low which would be wave 1 of the c-wave of the bigger (b) wave. Interestingly, with today’s deeper pullback, an a=c in purple is projecting to the .764 retracement of the prior decline. This type of confluence only increases the potential that a top of some sort is already in place.
Therefore, should the market be able to begin a 5-wave rally soon, then we will be watching that .764 retracement in both ES and SPX as our main resistance.
But, please take note that due to the ES making a lower low a few weeks ago, its .764 retrace is a bit different than the SPX. Therefore, I have estimated what that level would be in the SPX assuming we have struck a bottom as I write this update (which is certainly not clear that it has), and that is now the top of the purple c-wave box on the 5-minute SPX chart.
So, until the market is able to exceed that resistance, I am still going to be looking down for an ultimate break of the 7237SPX region.
Of course, should the market be able to rally to that resistance region and then pullback correctively and hold the pivot box, and then rally back over that resistance, that would swing the probabilities back towards the green count.
Clearly, the bulls have a LOT to prove to get that green count back into a higher probability scenario. For now, I am still looking down, but the exact path has yet to make itself known in a clear manner. But, pressure still remains down until we are able to break out over that (b) wave box on the 5-minute chat residing between 7709-7758SPX.
Should the market drop further, then I will adjust both the upside targets for the purple count, as well as the pivot. And, should we continue lower in a more direct fashion, I will be looking for see if the market is going to give us a clearer 1-2 downside set up in the red count. For now, I do not see anything highly reliable just yet.