Market Can Either Go Up Or Down
I know I am providing my update early today, but I want to reiterate that the market is likely going to make an important decision about the next trending 100-200 point move quite imminently. So, I wanted to reiterate my parameters again.
The title of this article is the most common comment I get about Elliott Wave analysis by those who really do not understand it to its core. And, it certainly feels like the comment is applicable at this time. So, I want to take a moment to explain what this analysis is providing to us from a deeper perspective.
First, I want to highlight that our Elliott Wave analysis caught the high we struck before we began this current pullback within 83 cents, with our ideal target being 3234SPX, and the market striking a high of 3233.17. But, more importantly, it also prepared us for what we expected to be a whipsaw market with a downside bias since that time. And, that is quite valuable information, since a trader then knows to become less aggressive during a whipsaw market as compared to a trending market.
Second, as I have highlighted in the past, there are going to be times when we will not have a strong expectation as to how the market structure is going to resolve in the near term. As I have quoted from The Elliott Wave Principle in the past, there is a paragraph by Frost & Prechter which I believe is extremely applicable to us today:
“Of course, there are often times when, despite a rigorous analysis, there is no clearly preferred interpretation. At such times, you must wait until the count resolves itself. When after a while the apparent jumble gets into a clearer picture, the probability that a turning point is at hand can suddenly and excitingly rise to nearly 100%.”
Currently, yes, the market has a structure pointing higher as well as potentially lower. We are at one of those junctures where we have to await for the market decision. However, what our Fibonacci Pinball method of applying Elliott wave analysis tells us is what levels the market tells us it will make a decision, and it then provides us with a high probability target once that decision is made.
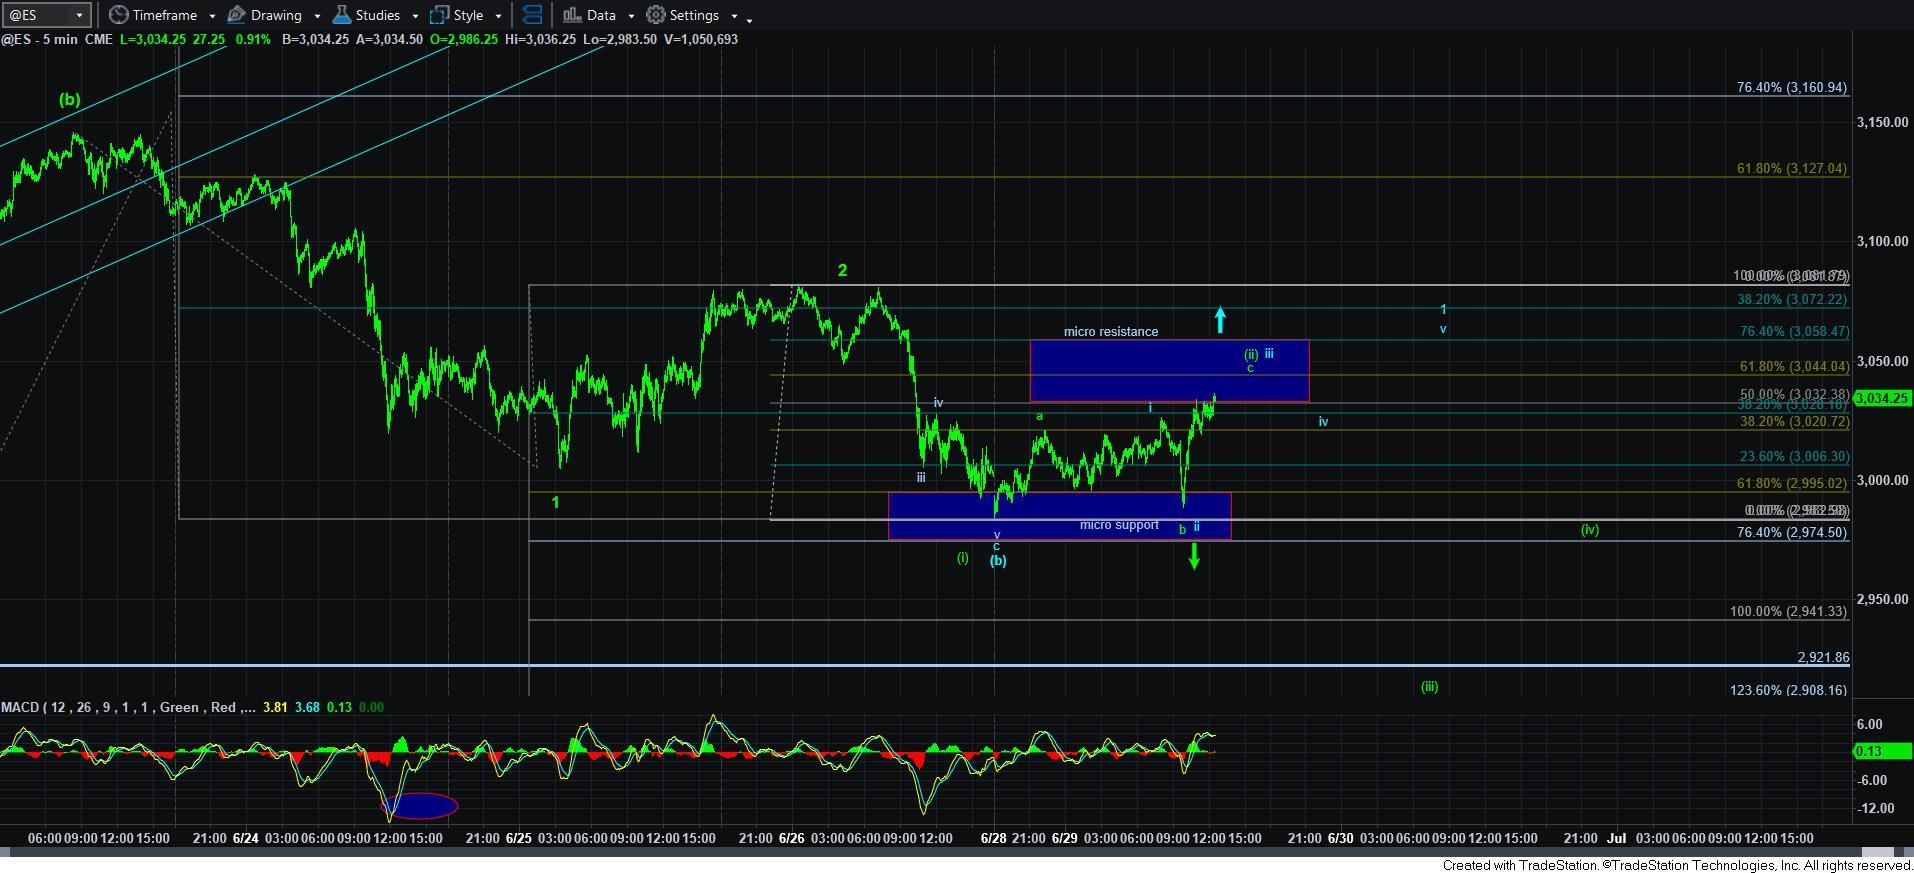
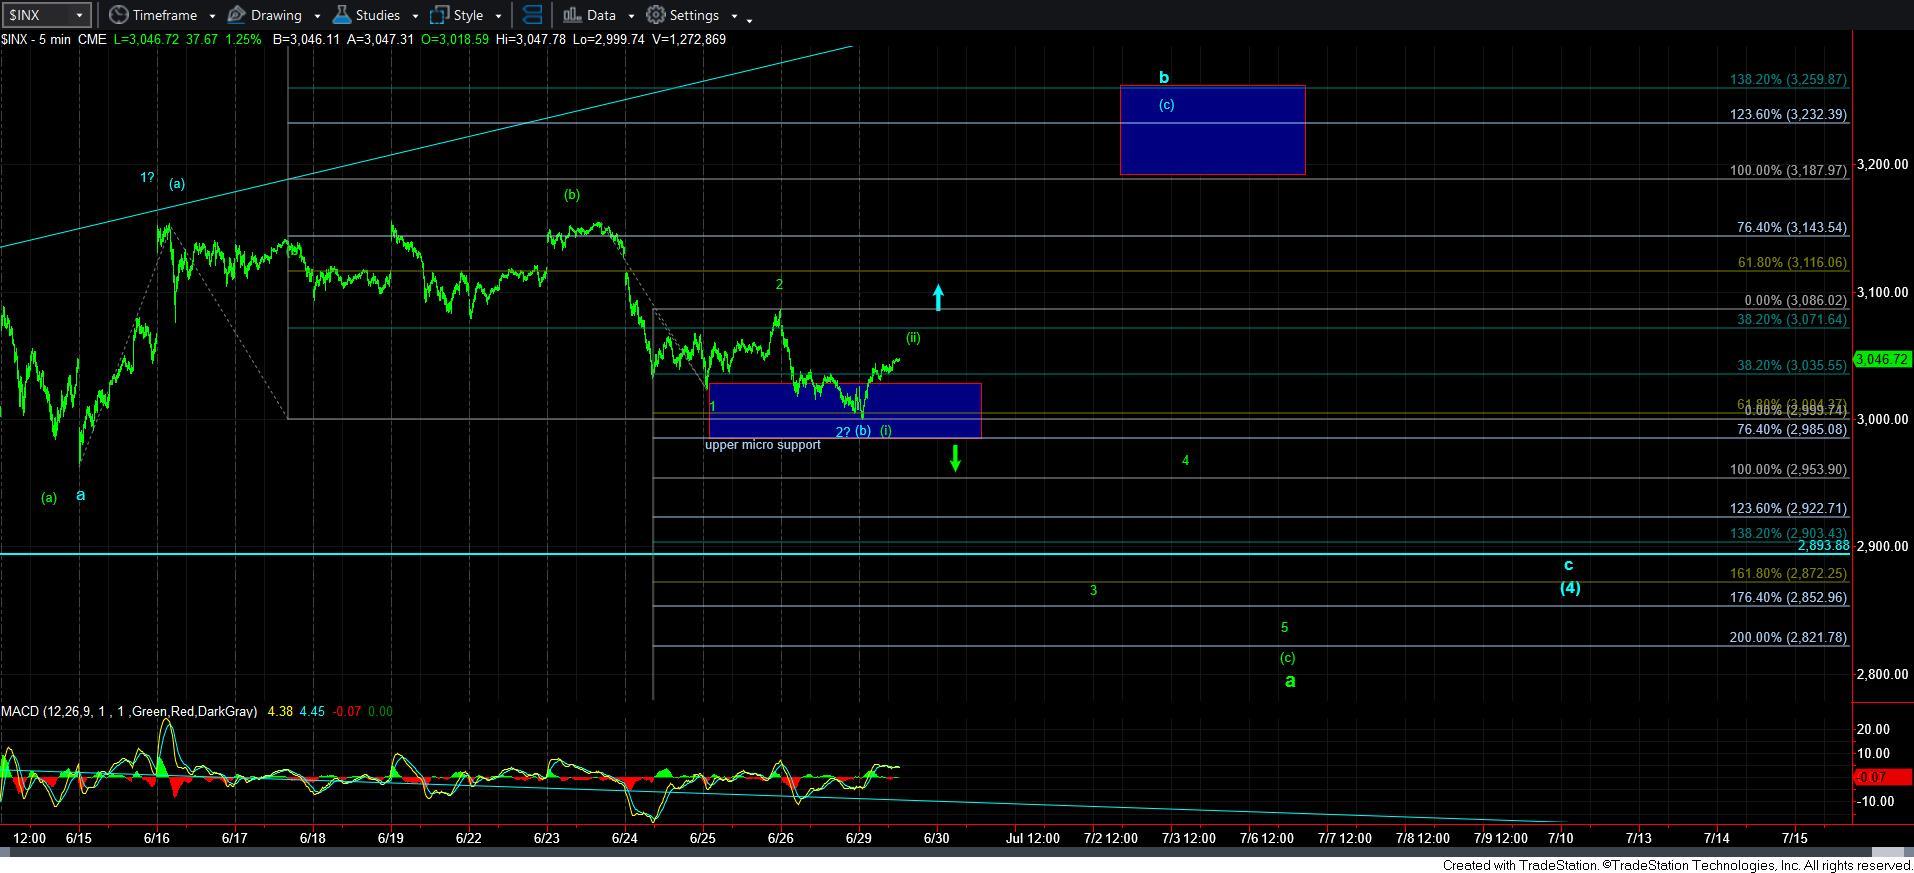
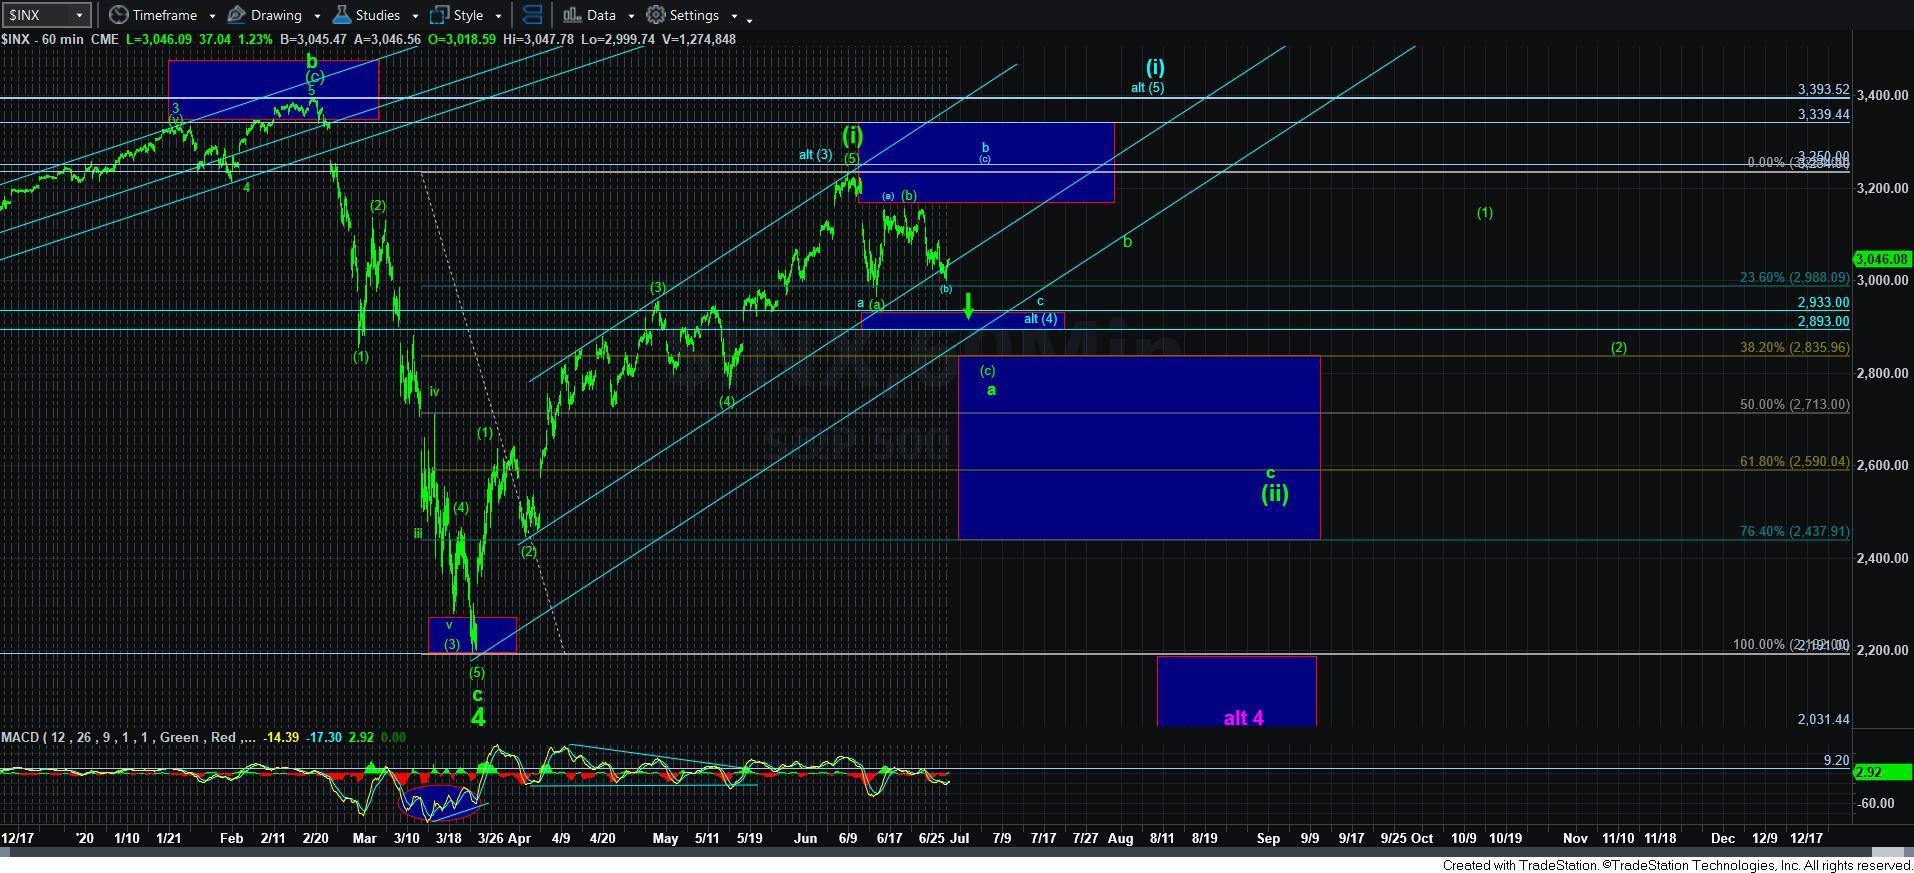
So, as we have been outlining over the last several days, as long as the ES/SPX respects its immediate resistance, and then breaks down below 2974ES/2985SPX, it will point us down towards the 2835SPX region for the [c] wave of the a-wave of wave [ii] in the green count, which is most clearly seen in the bigger picture presented on the 60-minute chart. However, I have also outlined the smaller degree path on both the attached 5-minute charts.
However, if the market is able to exceed the 3060ES resistance region, then it opens the door for the blue count to take us back up to the 3200SPX region, and even leaves the door wide open to take us as high as the 3400SPX region to complete wave [5] of [i], as presented in blue on the 60-minute chart as well. Much will depend upon the structure of the rally through 3060ES should the market break out to the upside.
Should the market choose the path of the immediate break down presented in green, then a break down below 2975ES will make the 2995ES level immediate resistance, which should contain all bounces on our way down ultimately to the 2835SPX region, as I outlined over the weekend.
However, if the market should break out to the upside instead, I will provide the Fibonacci Pinball support levels to track for those that are interested in trading the upside.
And, lastly, I want to remind you that even if the market does break out, and even if it continues up as high as the 3400SPX region and the prior all-time high, the greater likelihood is that we will see a bigger retracement in wave [ii] thereafter which should take us below the levels we reside at today. So, as we always say, know your time frame.