Market Breaks Upper Support but Holds Lower Support
 By
By
Today, the market broke lower, moving beneath the upper micro support that I outlined yesterday. With that break, focus now shifts to the larger support zone below, which has held thus far. From here, we will need to closely monitor the structure to the upside to determine whether the market can develop a full five-wave move higher, followed by a break of overhead resistance. That type of action would provide an indication that the market is ready to put in a bottom and push to new highs in the weeks and months ahead. Alternatively, failure to do so would suggest the market has other intentions and may be setting up for a deeper move lower.
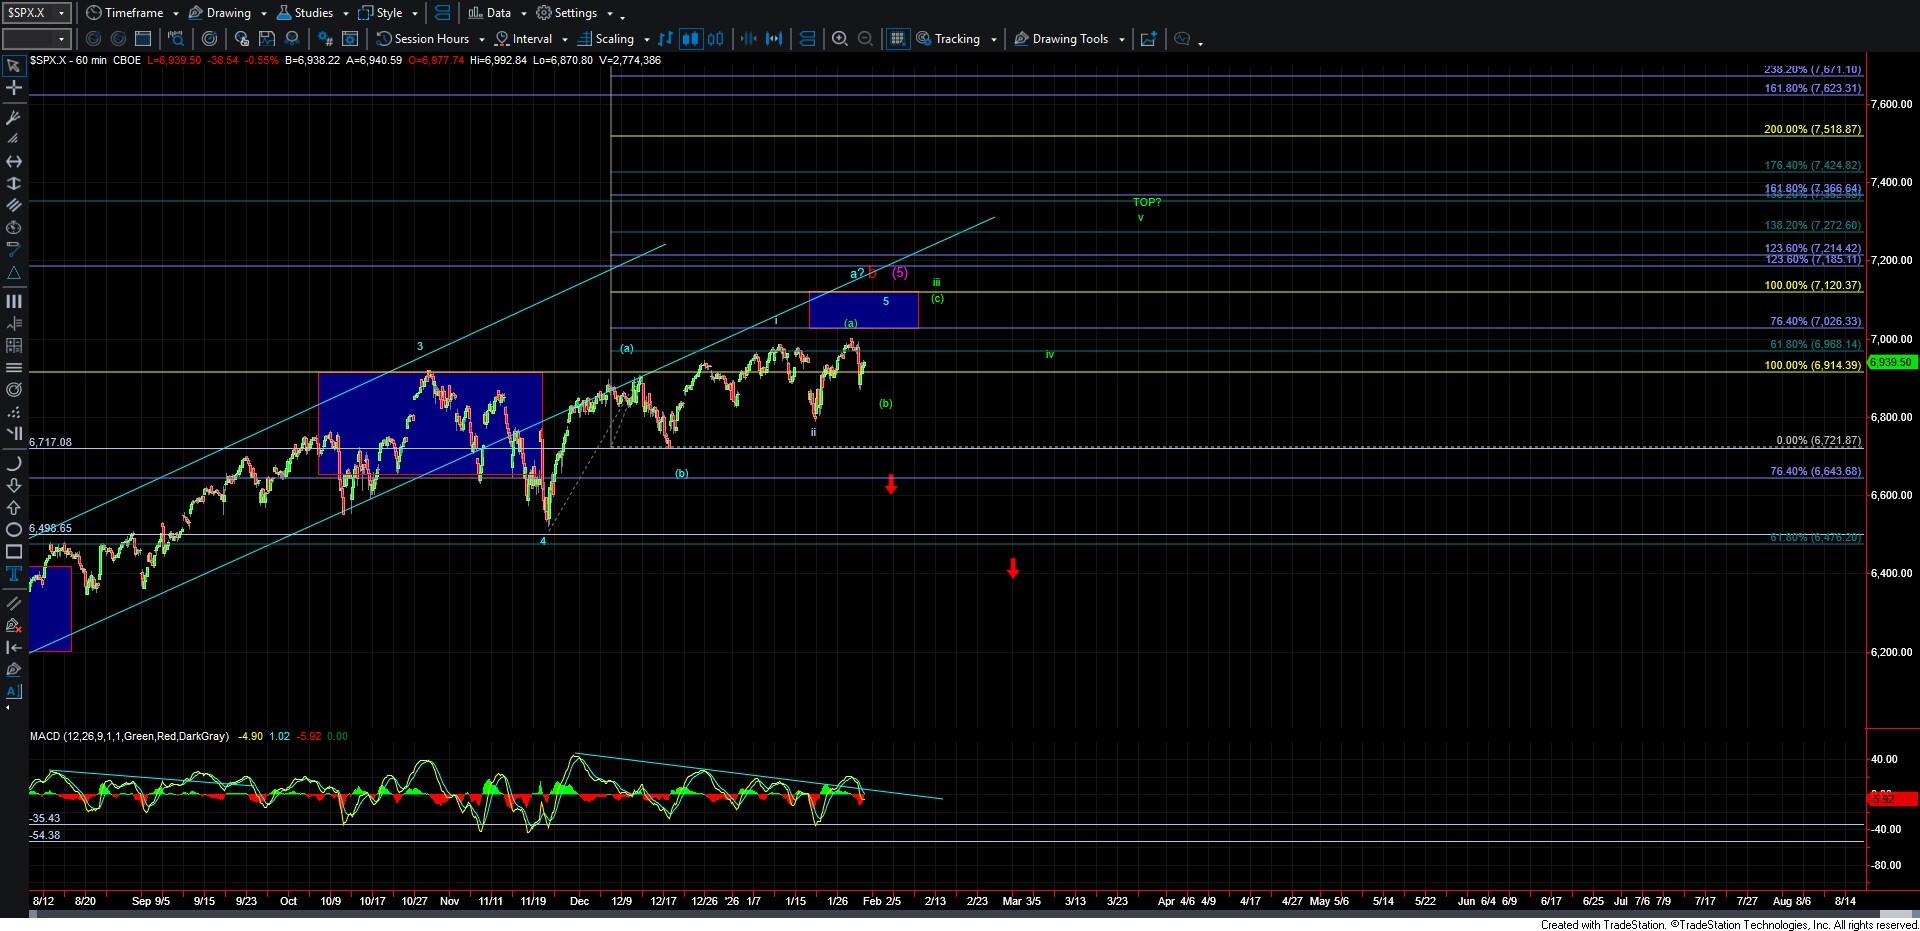
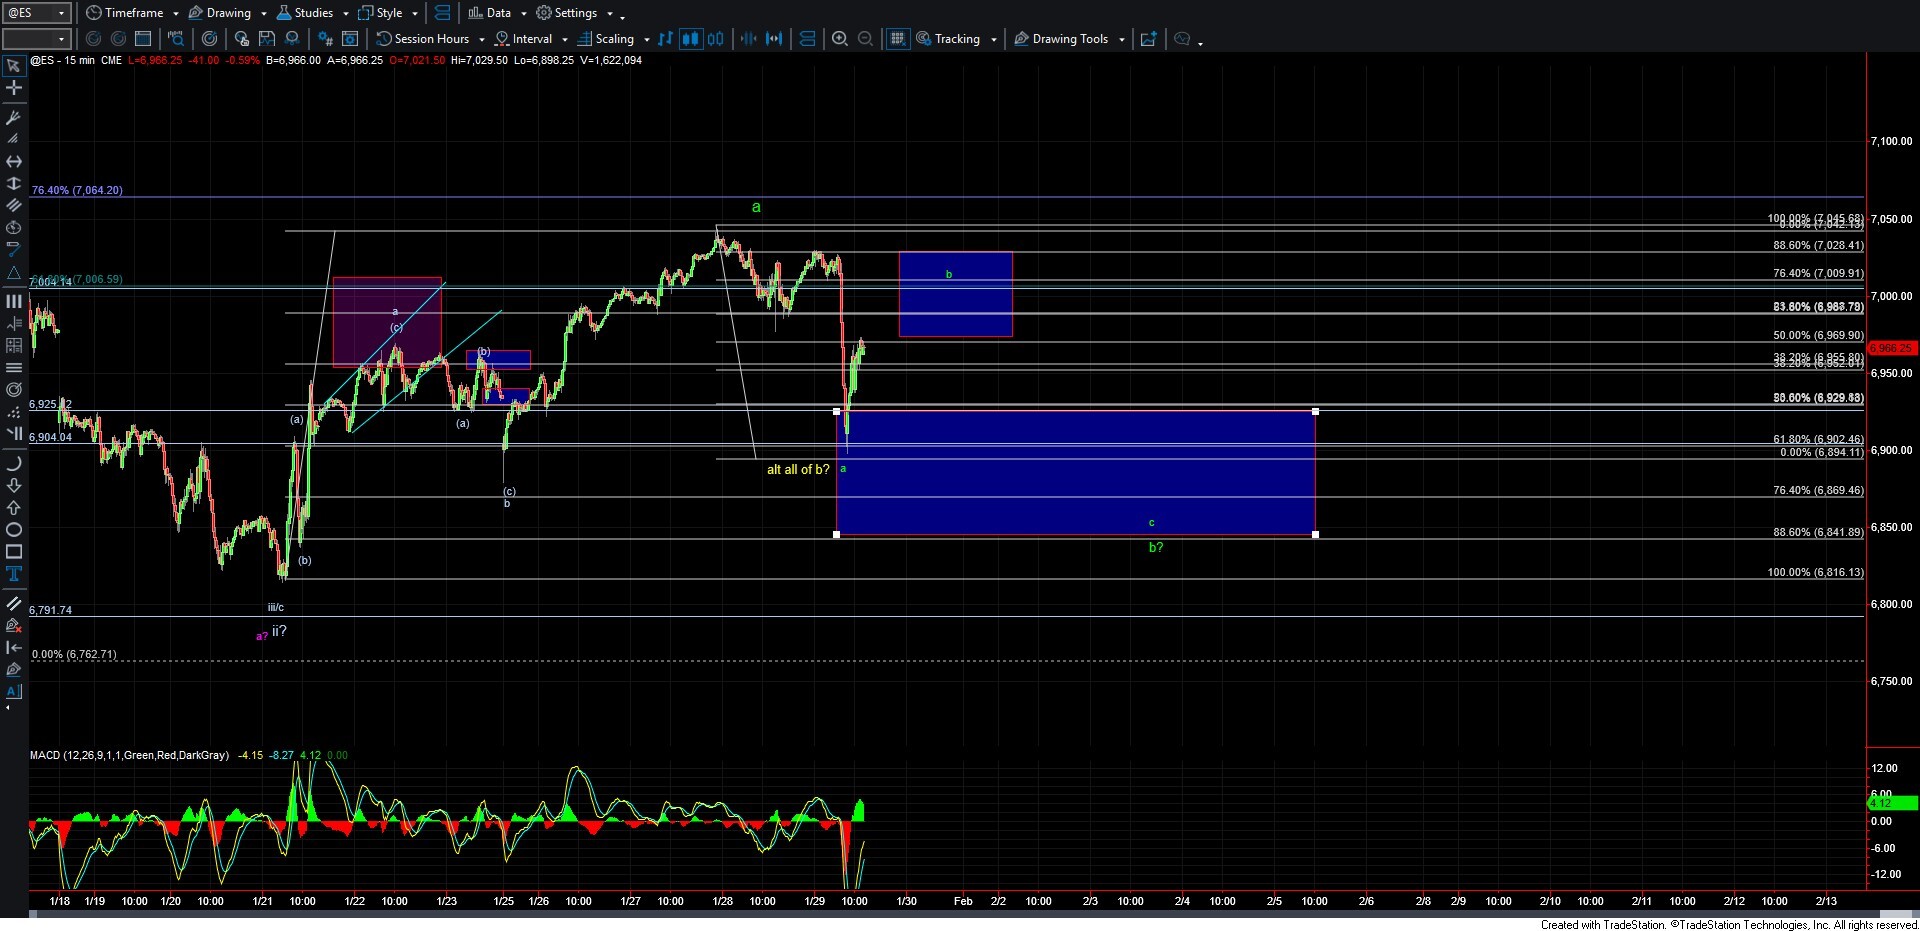
As shown on the ES chart, lower support is now coming in at the 6841–6869 zone. This zone has held so far and we have seen a bounce off of that zone. However, the move off the low remains corrective in nature, with only three waves up at this time, and price is still trading beneath key overhead resistance in the 6969–7028 zone. It will take a sustained break above that resistance and a clear five-wave move off the lows to signal that a bottom has been put in for wave (b) within the larger Ending Diagonal structure, as shown on the SPX chart.
Unless and until that occurs, the market may still be working through a larger wave (b), which could require additional downside before completion. Should price move lower again, the 6841–6869 support zone will be critical to maintaining the bullish structure. A decisive break below that region would open the door for a larger top to be in place. For now, however, as long as this support continues to hold, the market retains the potential to push higher in the weeks ahead.