Market Breaks Upper Support But Still Has More Downside Support To Break To Confirm A Top
 By
By
Today the market opened lower and saw some decent downside follow-through on the smaller timeframes and broke under the lower end of the upper support zone that I had laid out on yesterday's charts. This breakdown gave us an early confirmation that we may have indeed put a top in per the green count.
We do still have some further support levels to break below to give us additional confirmation that the green count has indeed topped. Furthermore, the structure of the next bounce should help give us additional information as to whether we have indeed put in a top in that green count or whether we still will see another push higher before a significant top is seen.
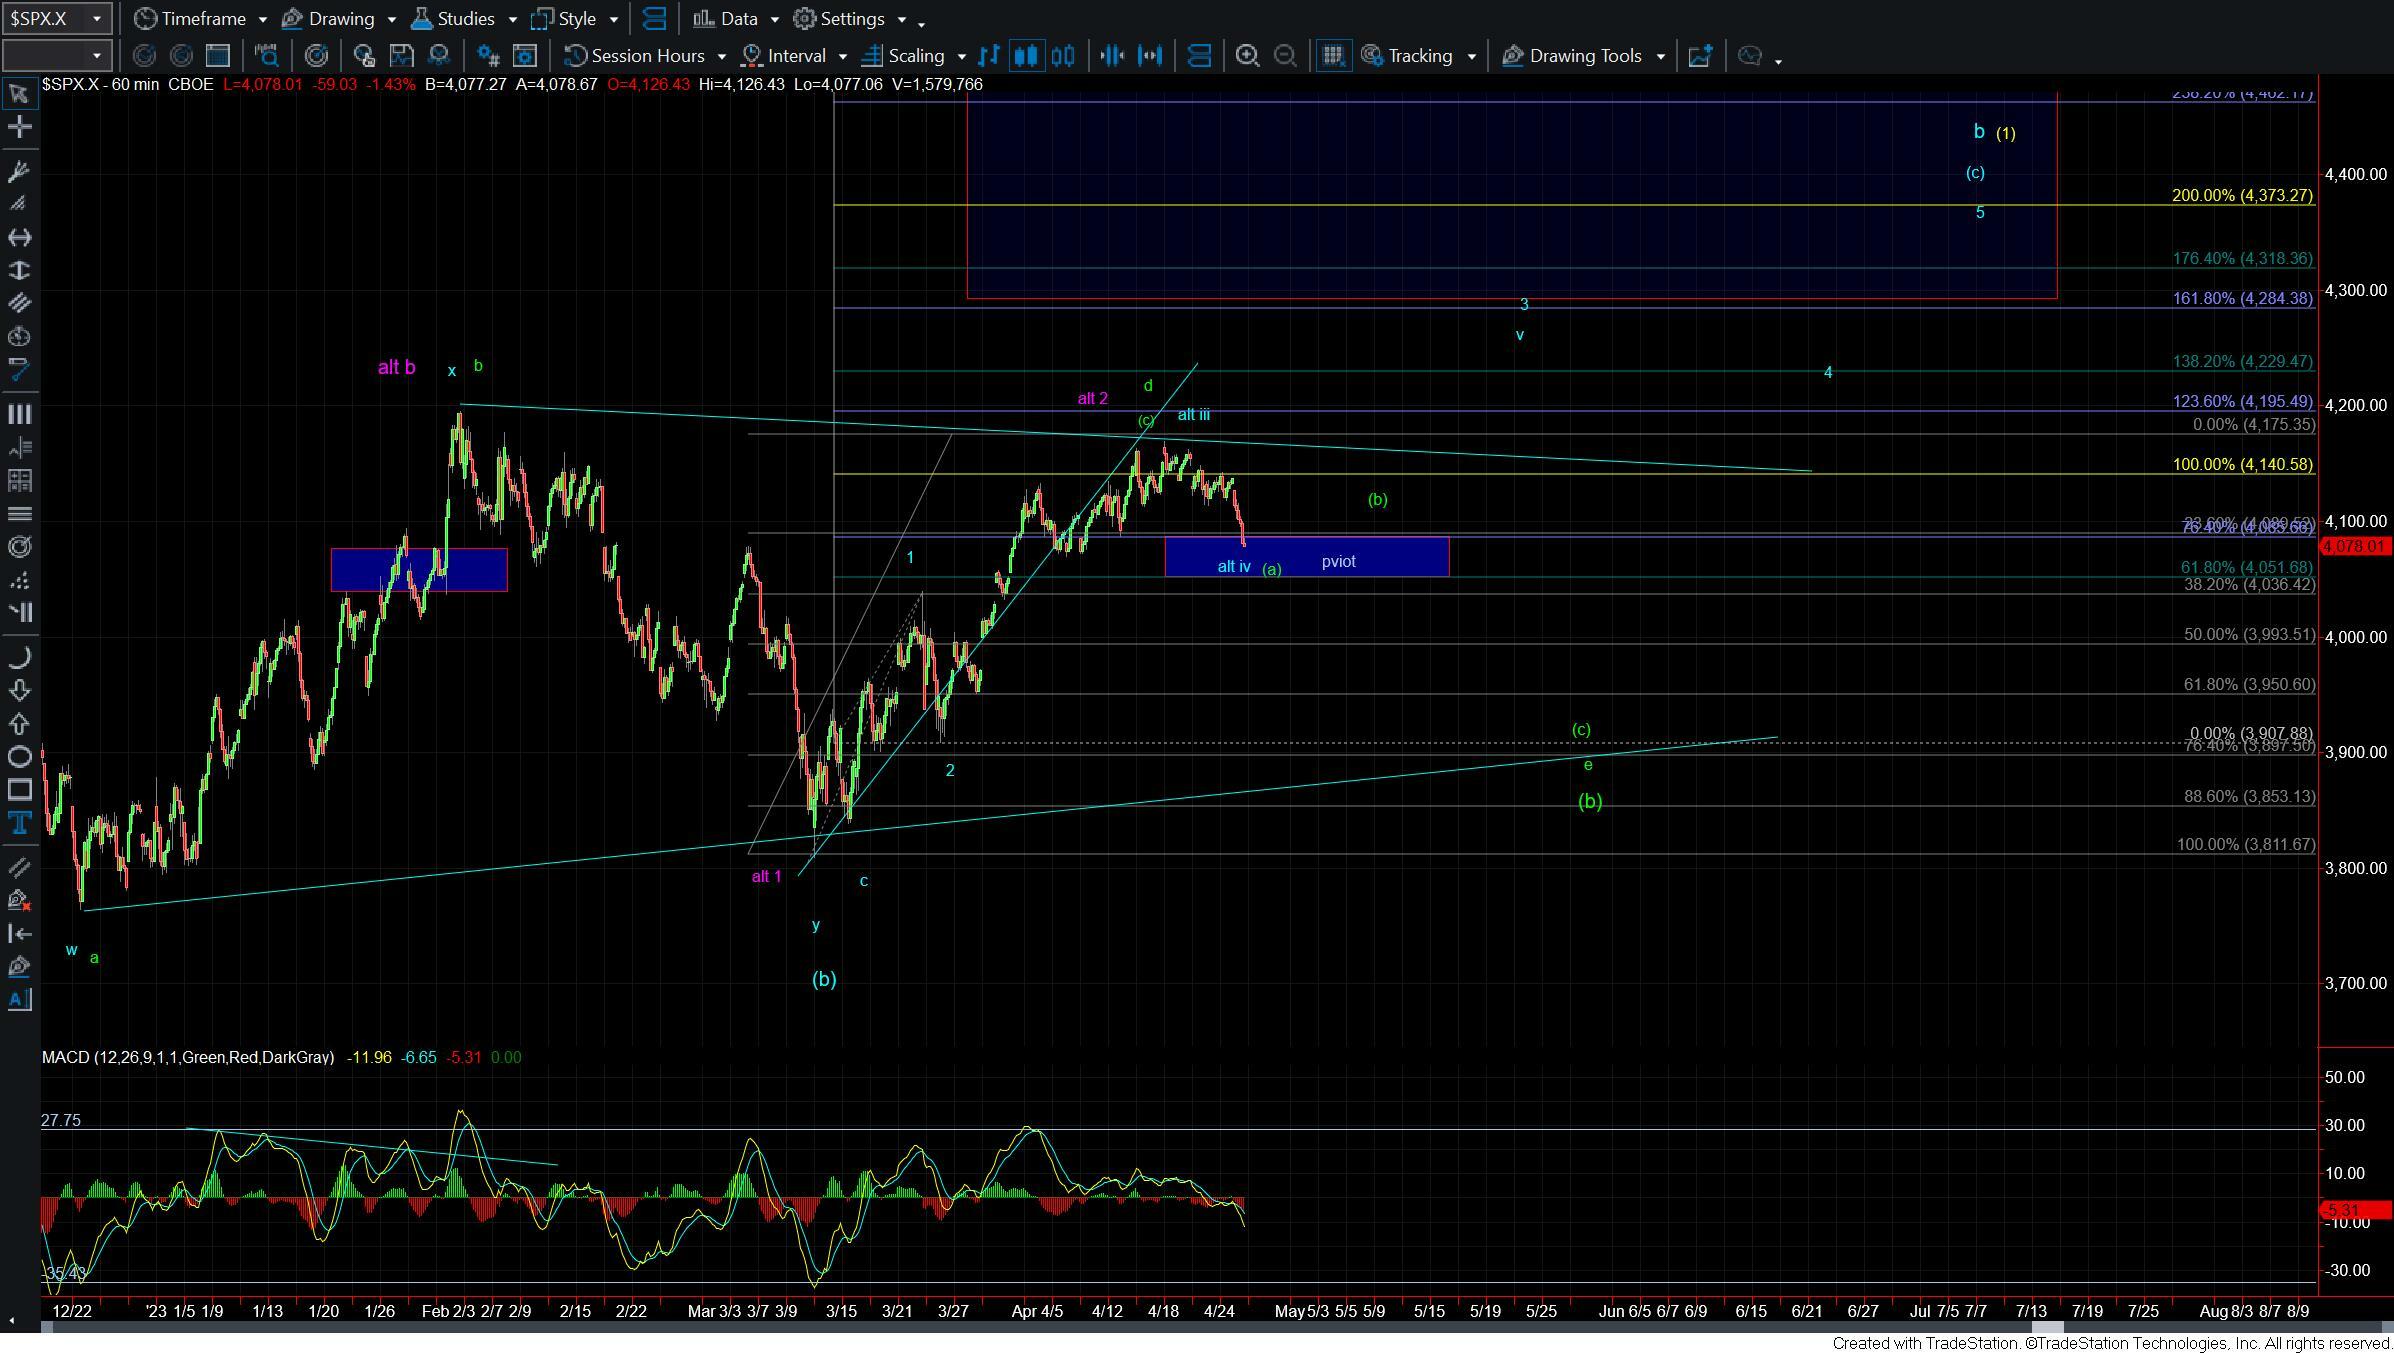
Bigger picture as shown on the 60min chart we are now entering the pivot region which is the 61.8-76.4 ext of the initial wave 1 up off of the lows. Should we see a break under this level it would give us further confirmation that we have indeed topped in all of the green wave d with the wave e of larger (b) now underway. If we are able to hold that zone and see a full five wave move up off of that region then it would open the door for this to see another push higher for the wave v of 3 per the blue count. We still would have several key resistance levels that would need to be broken overhead to suggest that we are indeed going to see a push to new highs so for now the blue court will remain the alternate path with the green count remaining the primary count.
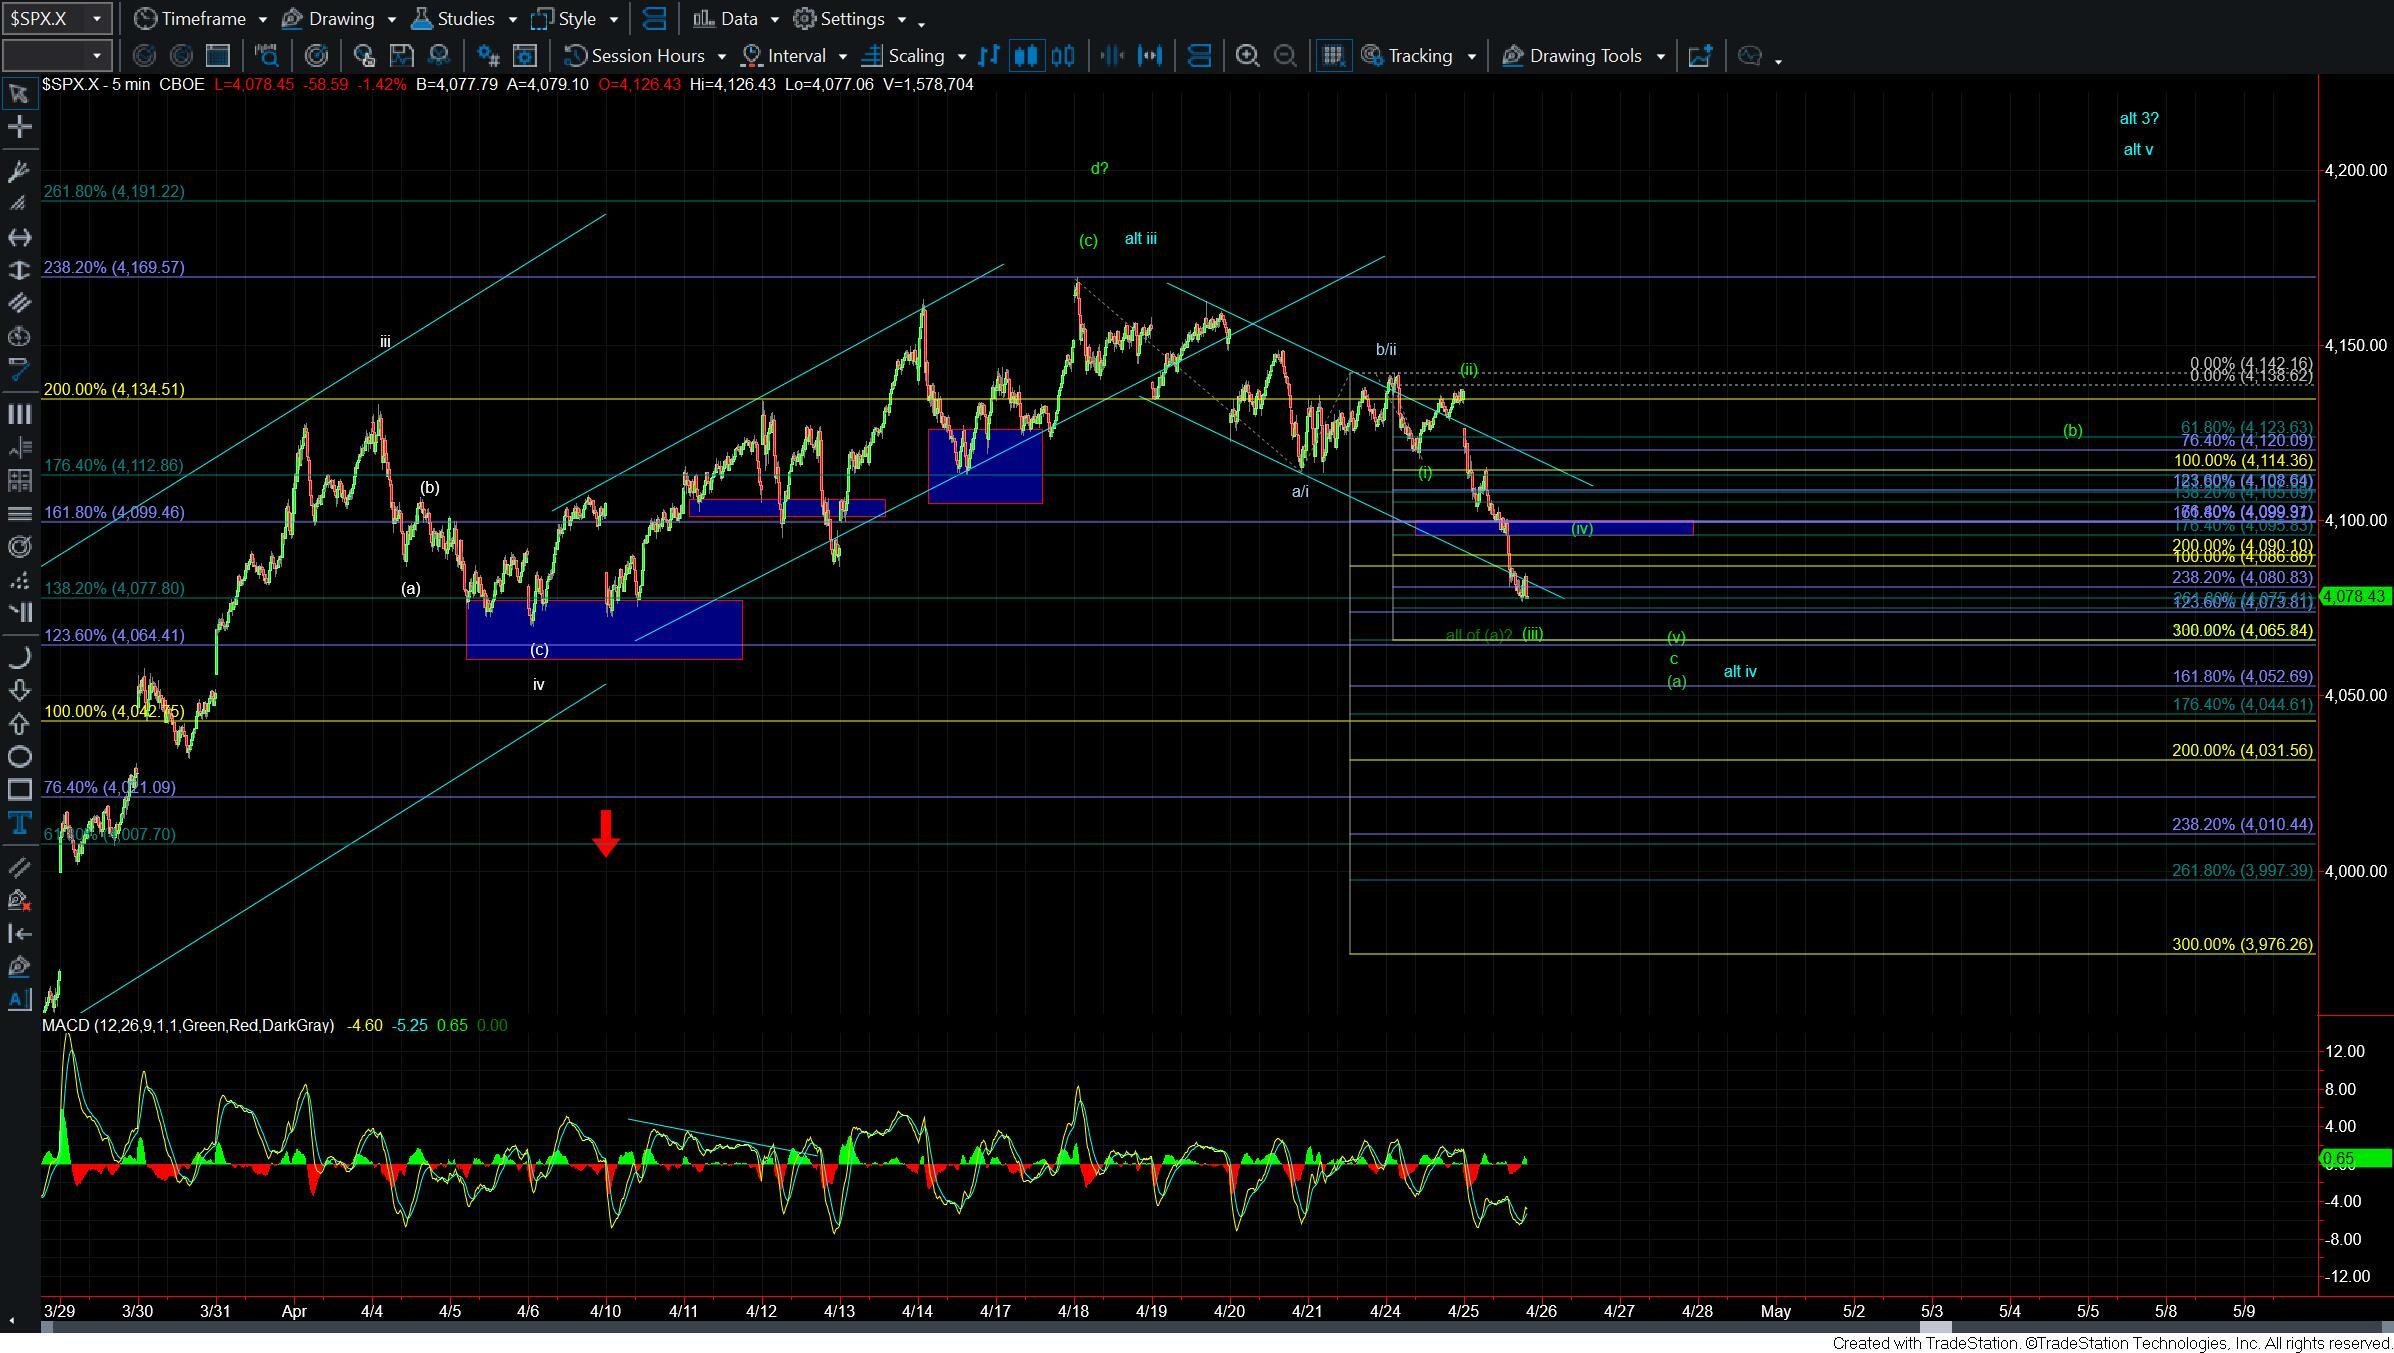
On the smaller timeframes while I do think that we are nearing a local bottom for the wave (a) structurally this would look better with another wave (iv) and (v) to finish off the initial wave (a) down off of the highs. As long as we can hold under the 4090-4099 region I do think this would look better with a bit lower to finish off the wave (a) towards the 4065-4042 region. Moving back up over that 4099 level, however, would be an early signal that we have put in a local bottom in either the green wave (a) or potentially the alternate blue wave iv.
So while today's move was certainly a good start to the topping process of our primary green count, we do still have a bit more work to do to confirm that we are already in the wave e. So from here keeping an eye on both the structure of the next bounce up along with how this reacts at support will be key in helping us confirm that we have indeed struck the top in that green wave b.