Market Breaks Up Once Again But Is It Ready To Breakout?
 By
By
The market pushed higher again, exceeding the previous high reached earlier this week. This continued upward movement suggests that the more immediate bullish count, as outlined on the smaller degree timeframes, is becoming more likely. However, the market is still trading under a number of key resistance levels that need to be broken to provide final confirmation that the market is ready to move towards the 4300 region.
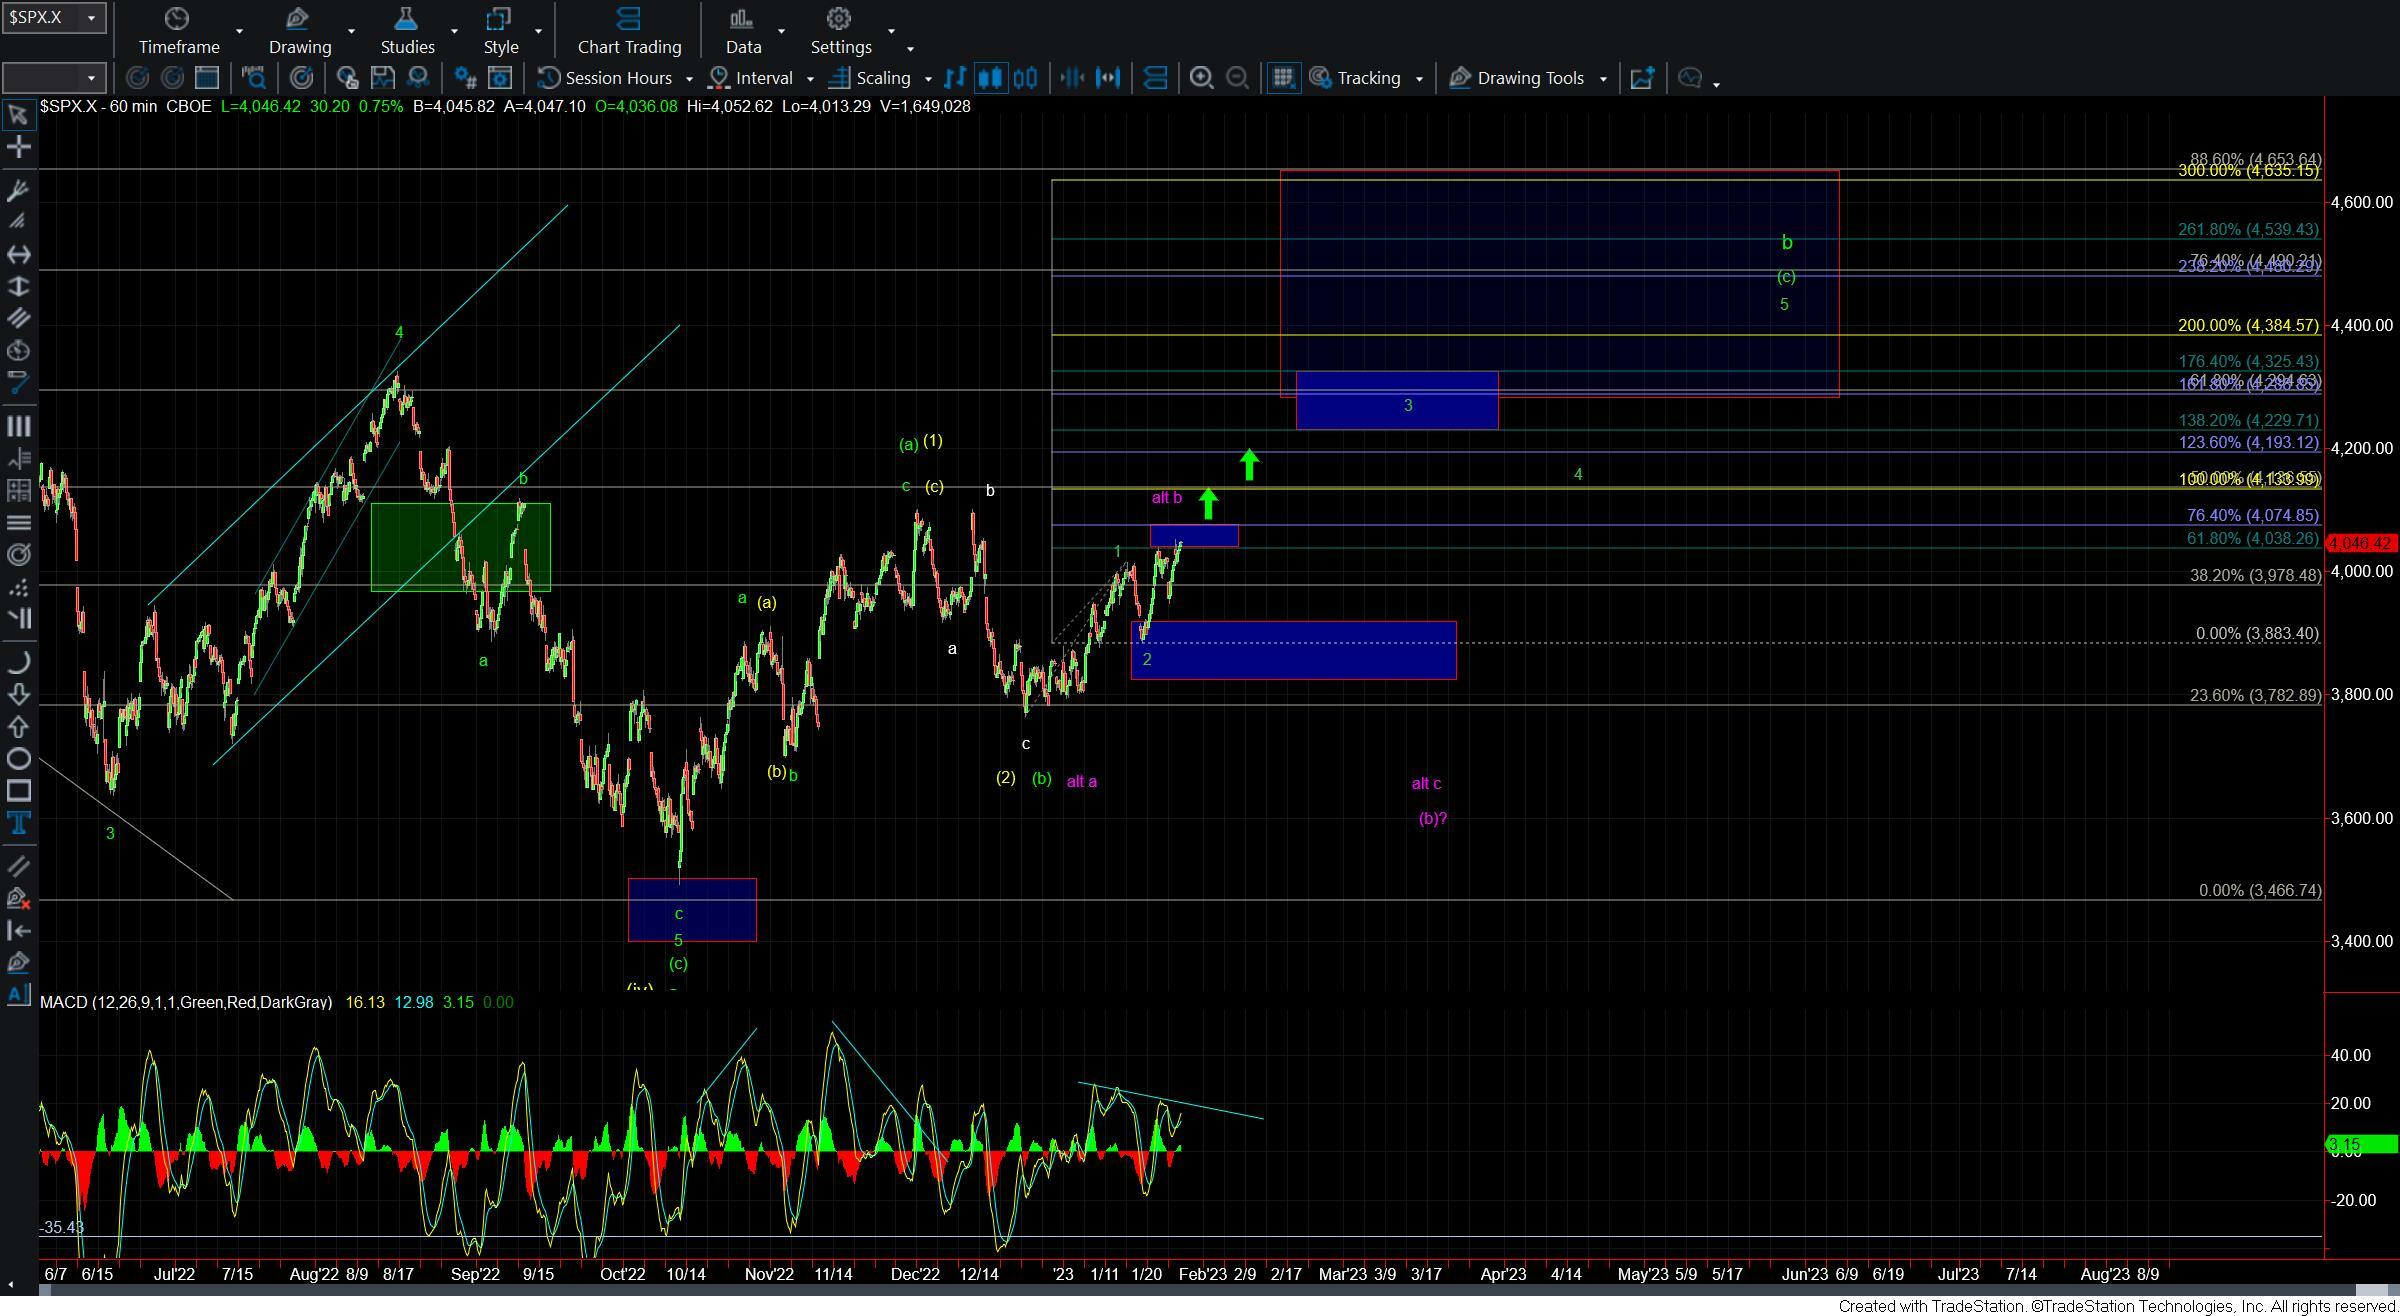
To gain a better understanding of the market's current state, it may be more appropriate to focus on the 60-minute chart as the parameters on this chart are clearer and less ambiguous compared to those on the smaller degree timeframes.
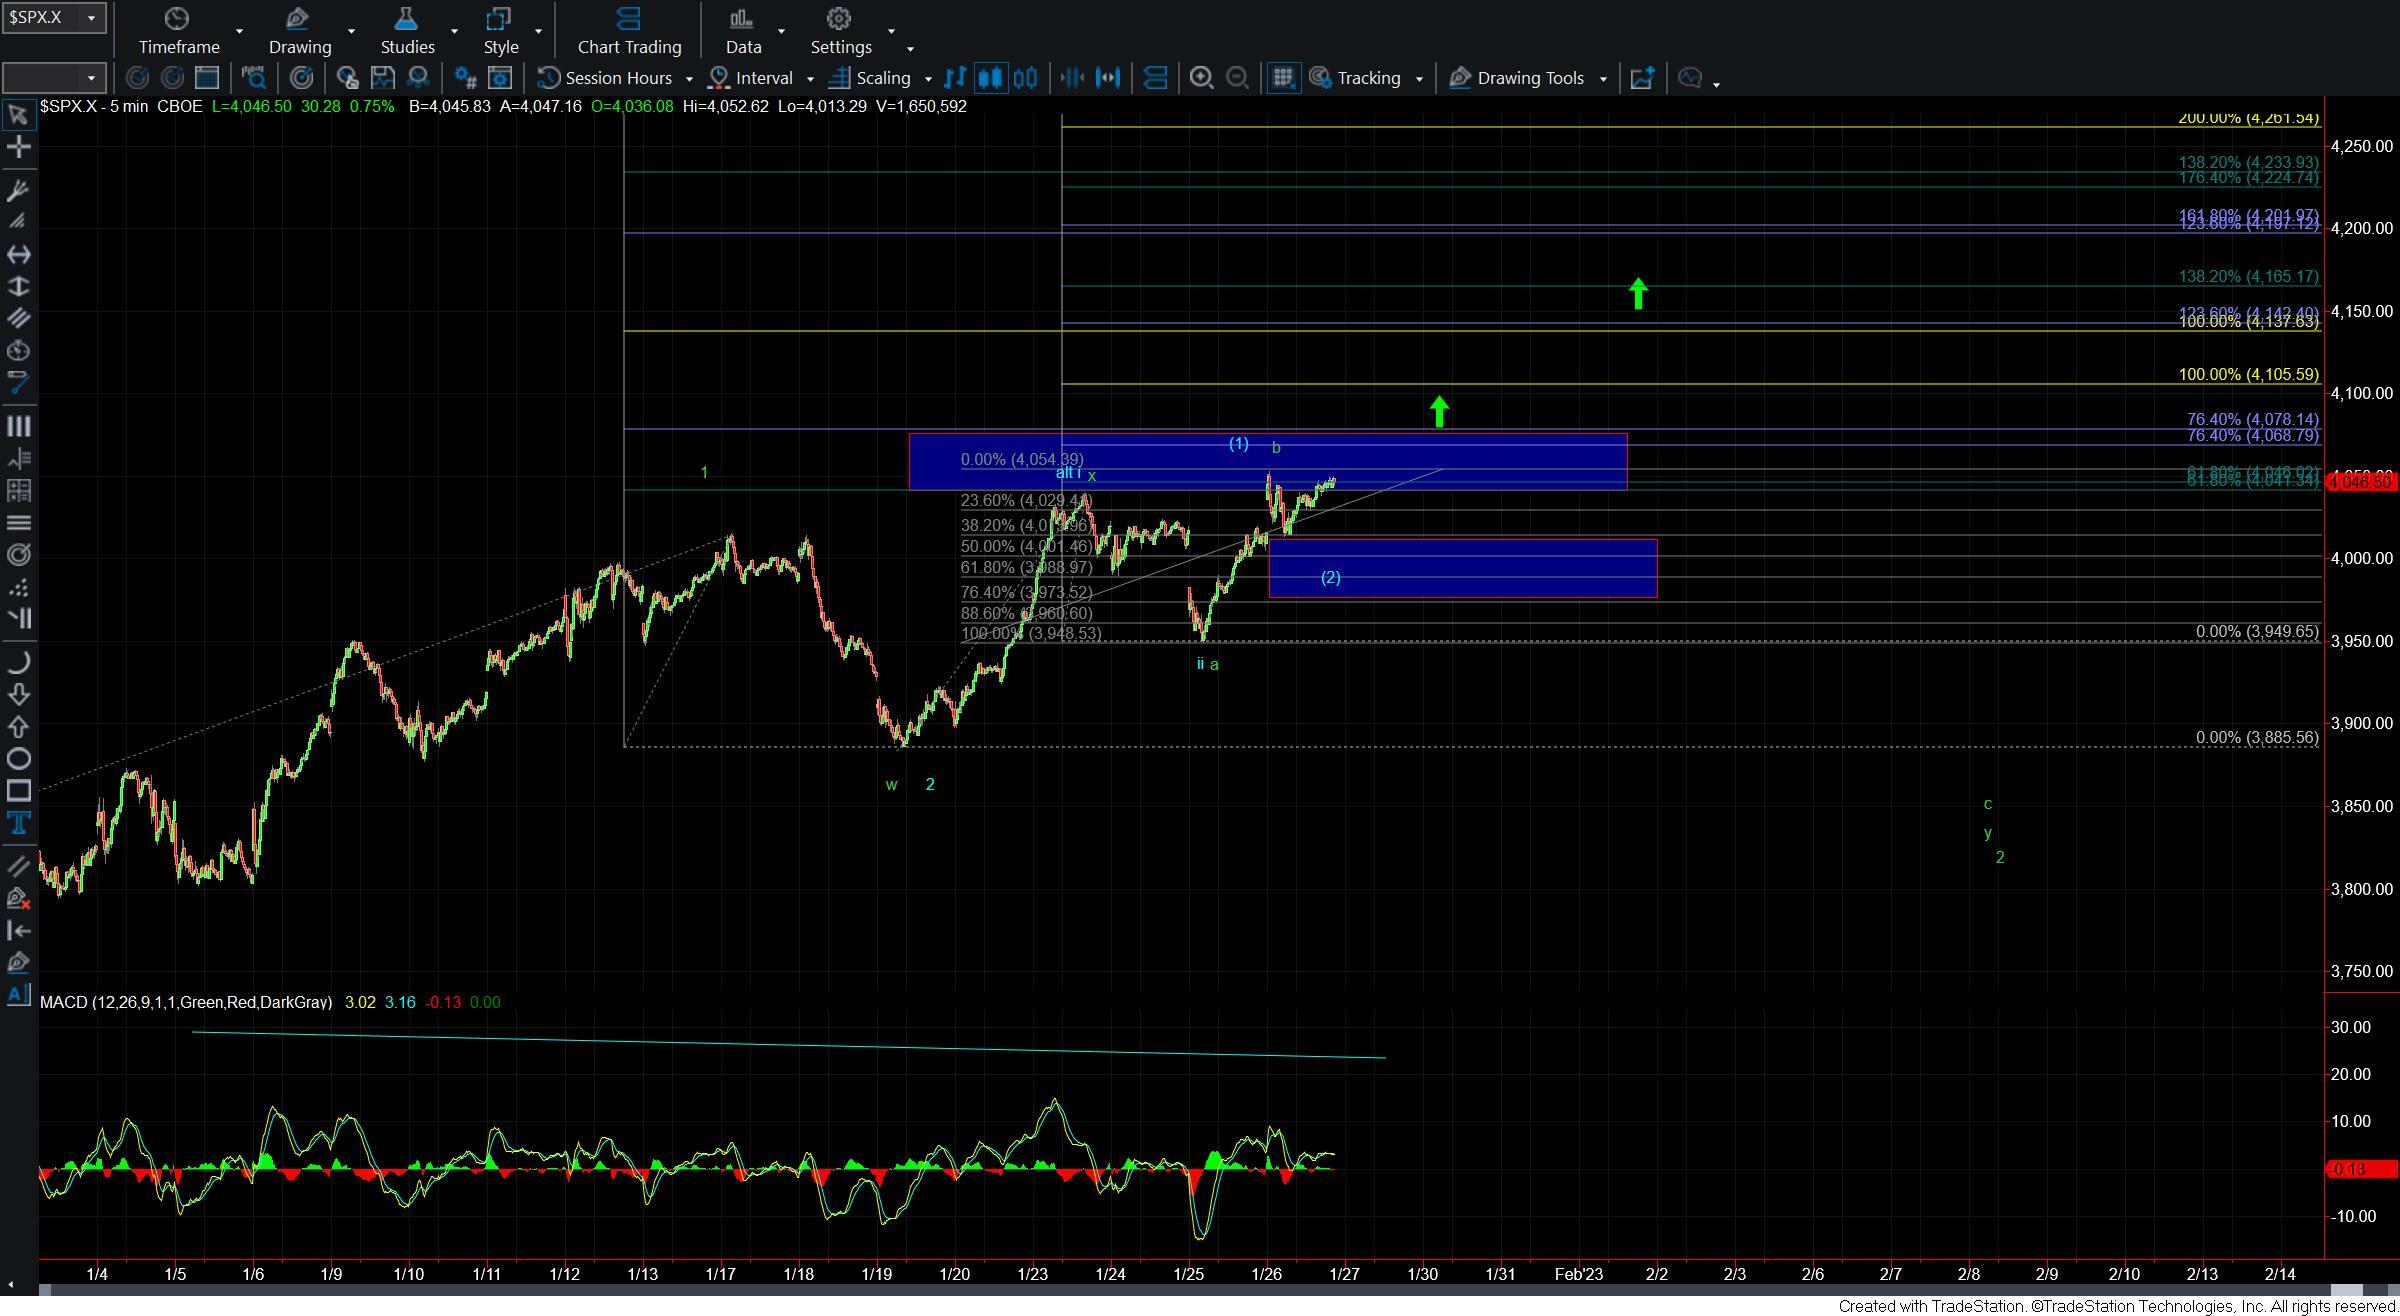
From the lows reached on December 22nd, we have identified a five-wave move, which we are counting as wave 1. This wave retraced to the 3883 level for wave 2. These two points are clearly established at this point in time. However, the micro-wave action on the 5-minute SPX chart is slightly less clear and there are still a couple of different paths that it may take. Both paths ultimately resolve upward, it is simply a matter of whether we will see a pullback, as shown by the green count on the 5-minute chart, or a more direct breakout, as outlined in blue on the same chart.
The key takeaway under both of these paths is that once the market breaks out over the 4074 level on the SPX, we are likely to have begun the heart of wave iii of 3 up. From there, we should see a break over the 4133 level, which would then target the 4229-4325 zone for wave 3 of (c) with ultimate targets for wave 5 of (c) in the 4384-4400 region. Until the market breaks out over the 4074 level, we may still see a pullback below the 3946 level. However, with today's price action, it is becoming more likely that we will see the more direct path higher.
While there is still more work to be done before confirming a breakout, the market is showing signs that the bulls are in charge. If the market breaks out over the 4074 level, any pullbacks will be limited and it becomes more probable that we will see higher levels in the early part of this year.