Market Breaks OutsAnd Up But We Are Still Not Out Of The Woods
 By
By
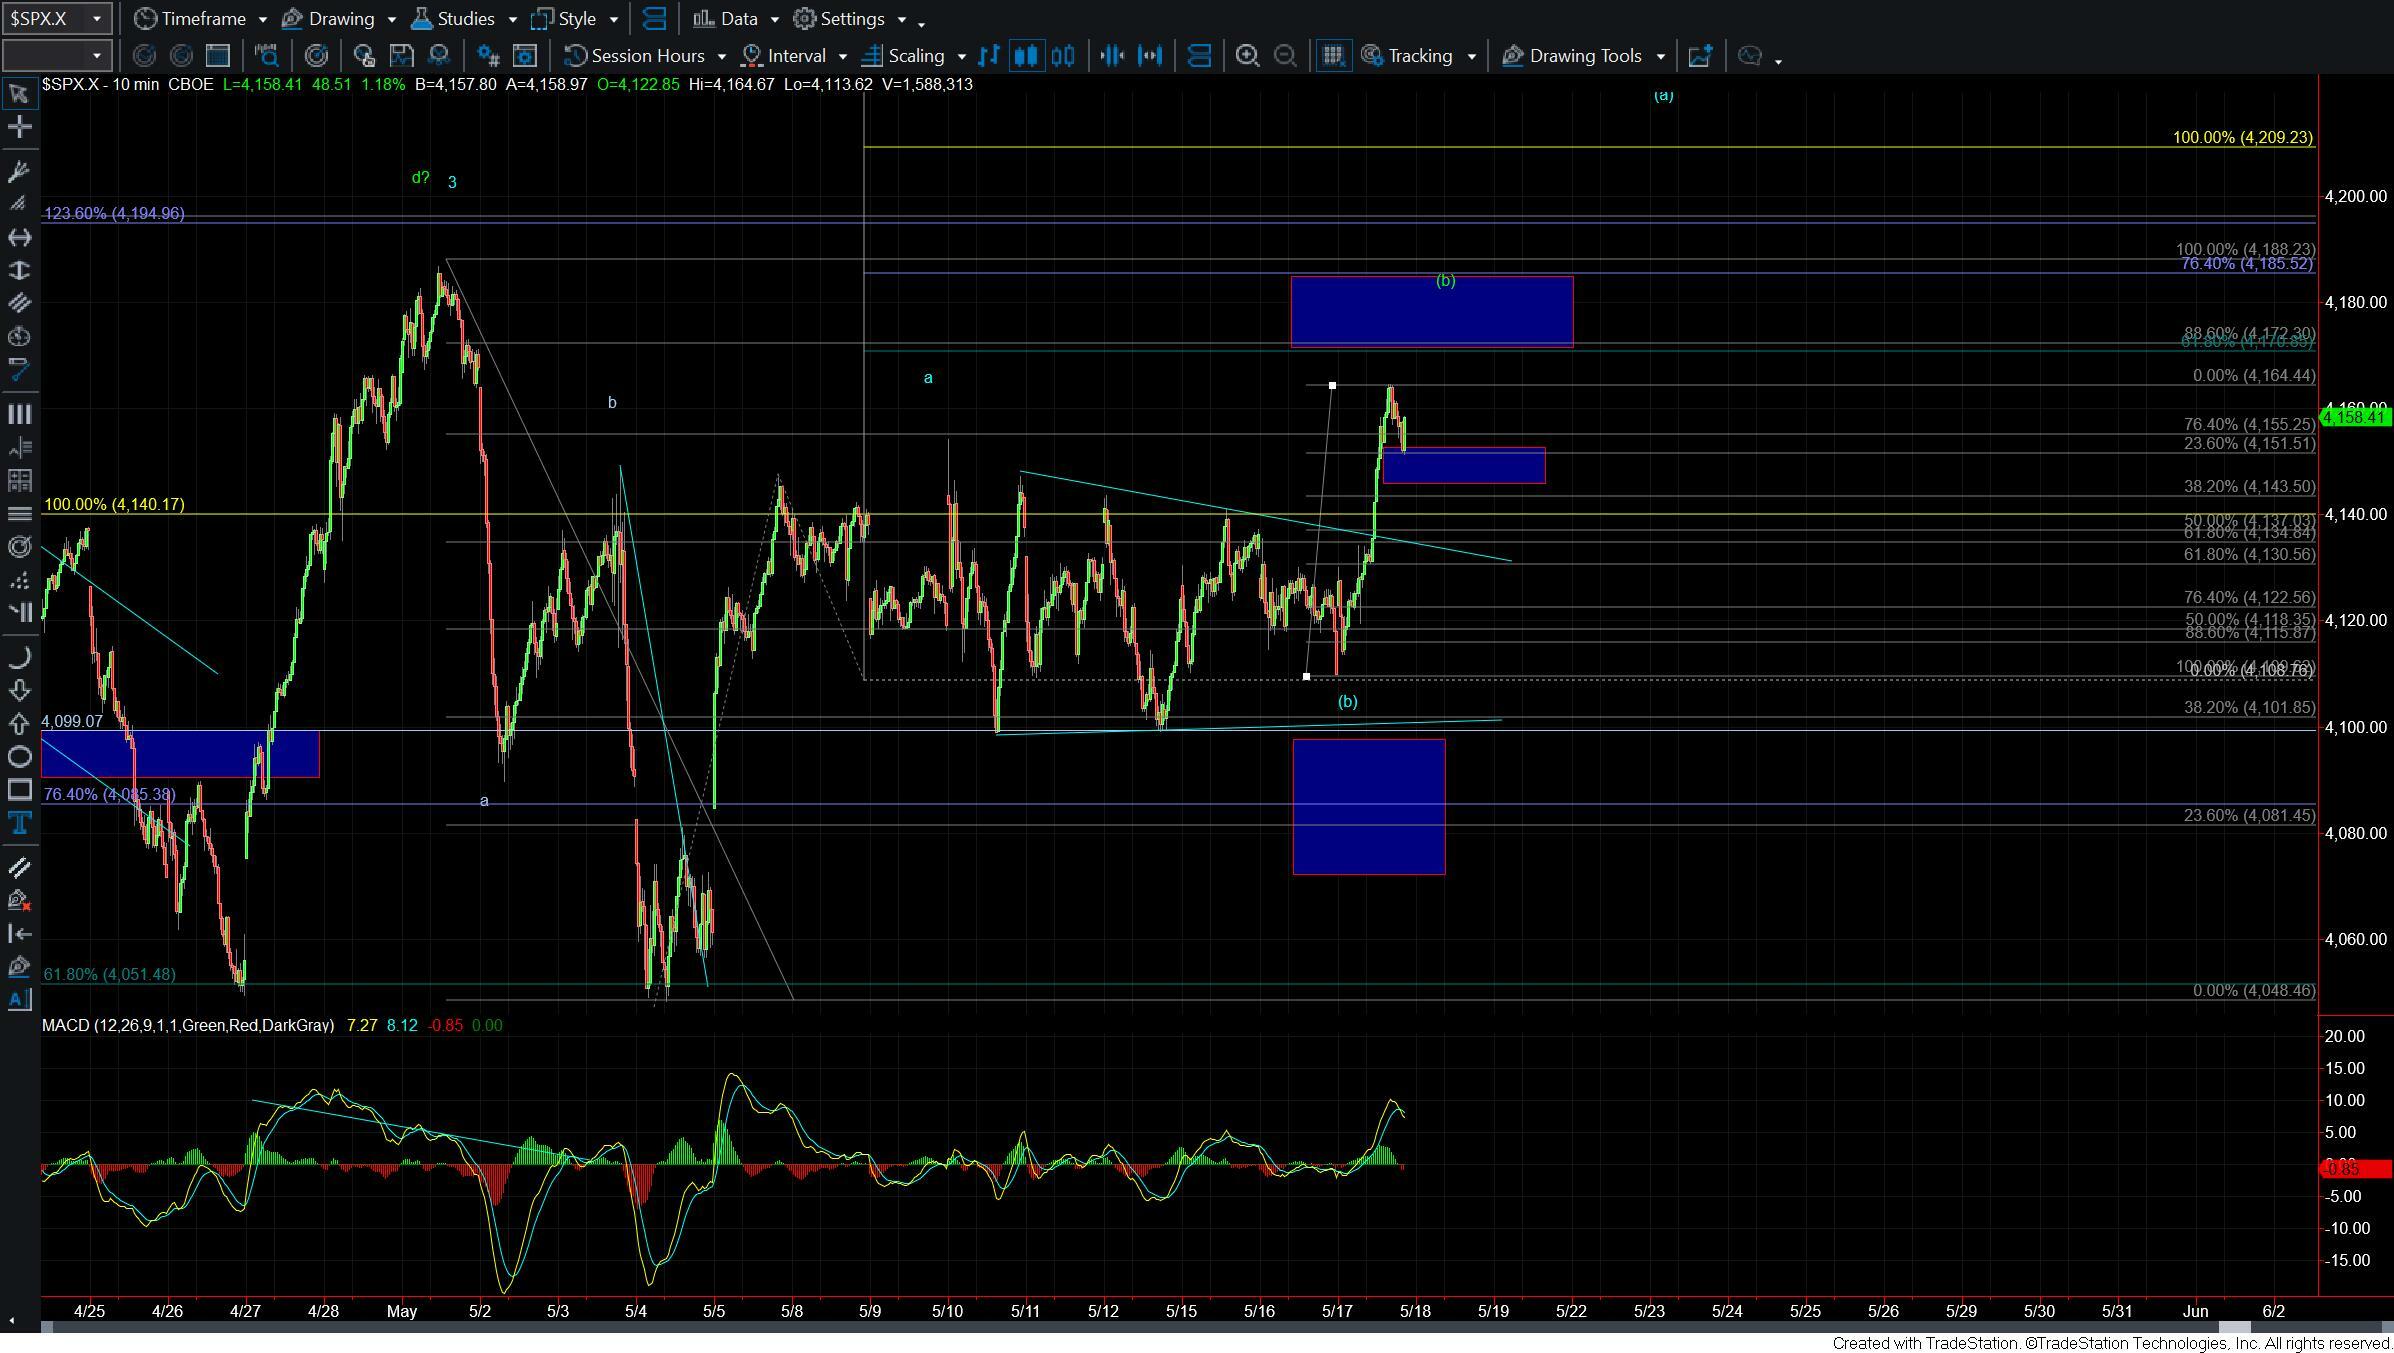
After consolidating for several weeks we finally saw the market breakout and up of the micro triangle that had been forming over the past week. This breakout to the upside and over the top of the wave a as shown on the 10min chart is certainly a good start to confirming that we have begun the final leg up in the wave 5 per the blue count.
We do however still need to break through some key overhead resistance levels before we can confirm that we are indeed honor way to new highs. Until that occurs I still remain somewhat cautious here and have to allow for today's push higher to be a wave (b) as part of the green count which still has this topping in the larger degree triangle. If we can manage to break out over that resistance level we should however be on our way to new highs to finish off the larger move to the upside per that blue count.
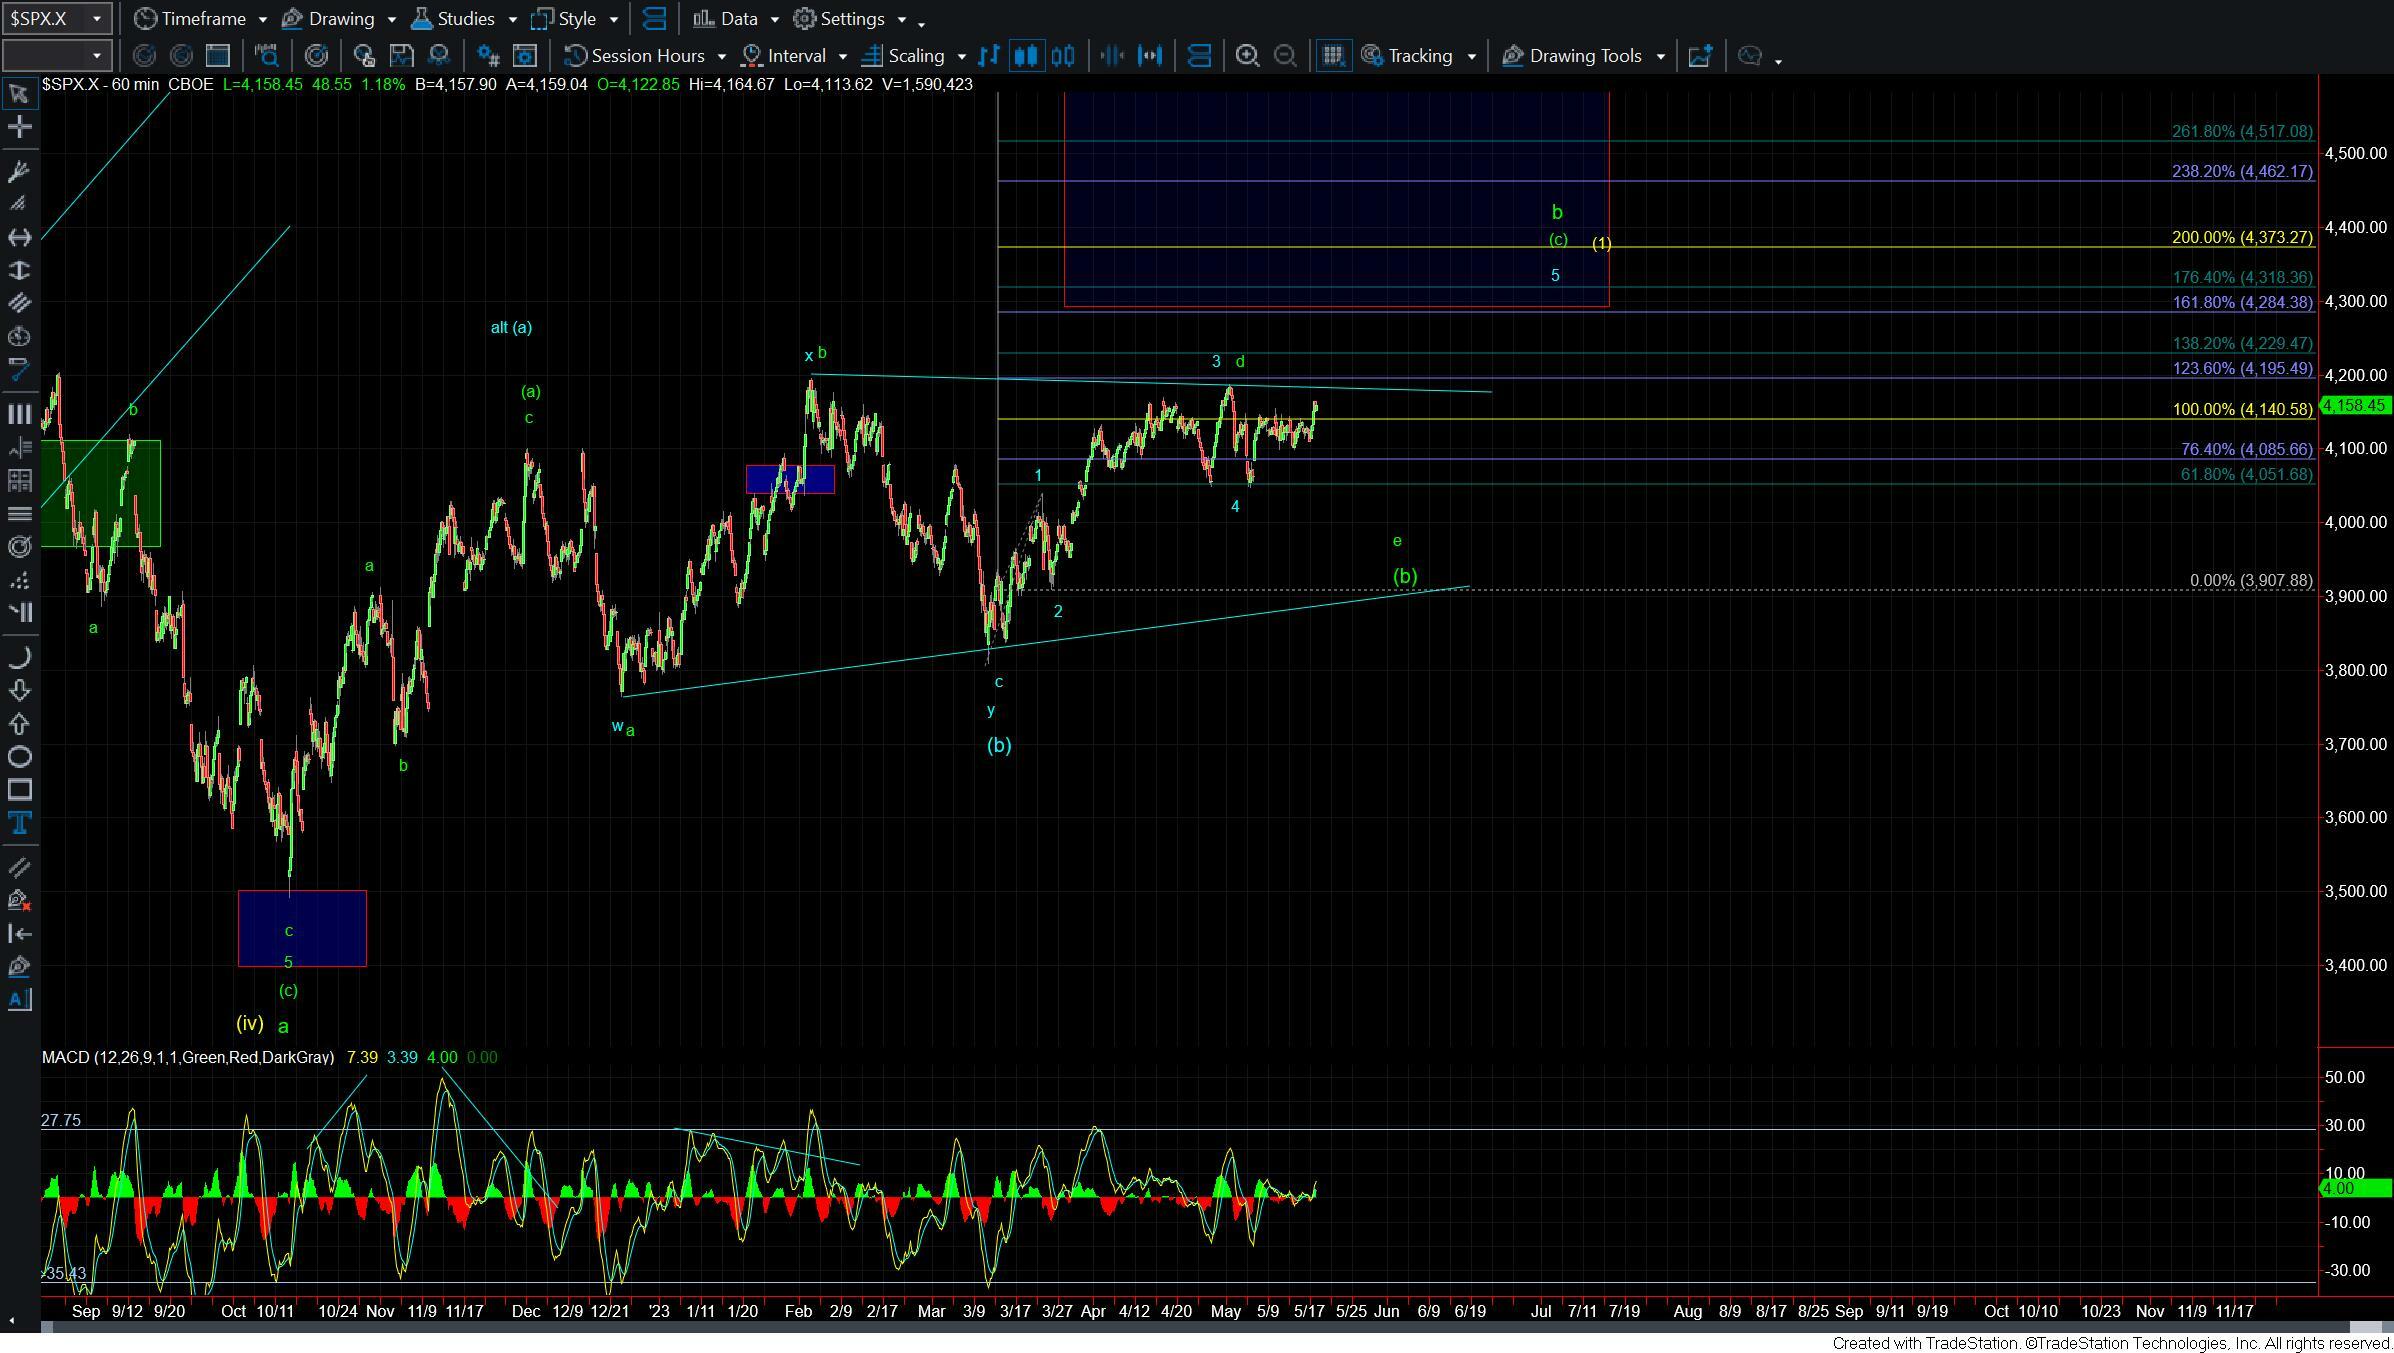
The bigger picture there is really not much change as we are still watching the blue and green counts. The blue count suggests we are going to see a higher high to finish off the wave 5 of (c) of b. The green count would suggest we still need a lower low for the wave e of (b) to finish off the larger wave (b) triangle. Again nothing really has changed in this bigger-picture perspective for some time.
On the smaller degree timeframes this breakout today is going to need to break over the 4176-4185 zone overhead to give us further confirmation that we have bottomed in the wave (b) per the blue count. If we can get through that zone then the next key overhead resistance level is going to come in at the 100ext of the wave a at the 4209 level. From there things may get a bit more complex as we are likely going to be dealing with a series of three wave moves to finish off the larger Ending Diagoanl for this wave (c) of b however moving through those levels will be the next level of confirmation that we are indeed following the blue count.
If we are unable to continue to push higher but rather break under the 4130-4122 zone below then it would open the door for this to have topped in a wave (b) which I am showing in green on the 10min chart. This wave (b) would be part of a larger ABC down off of the May 2nd high having topped in the wave d of the larger green triangle.
This breakout has given us an early level of confirmation that we are indeed following the blue count. So as long as we can remain over-support noted above, I will continue to give the benefit of the doubt that we will see this resolve to the upside per the blue count. I do however want to note that given how complex this market has been over the past several months we do need to remain on our toes until we do see final confirmation with a breakout over the key pivot levels noted above.