Market Breaks Initial Support, Opening the Door for a Larger Top
 By
By
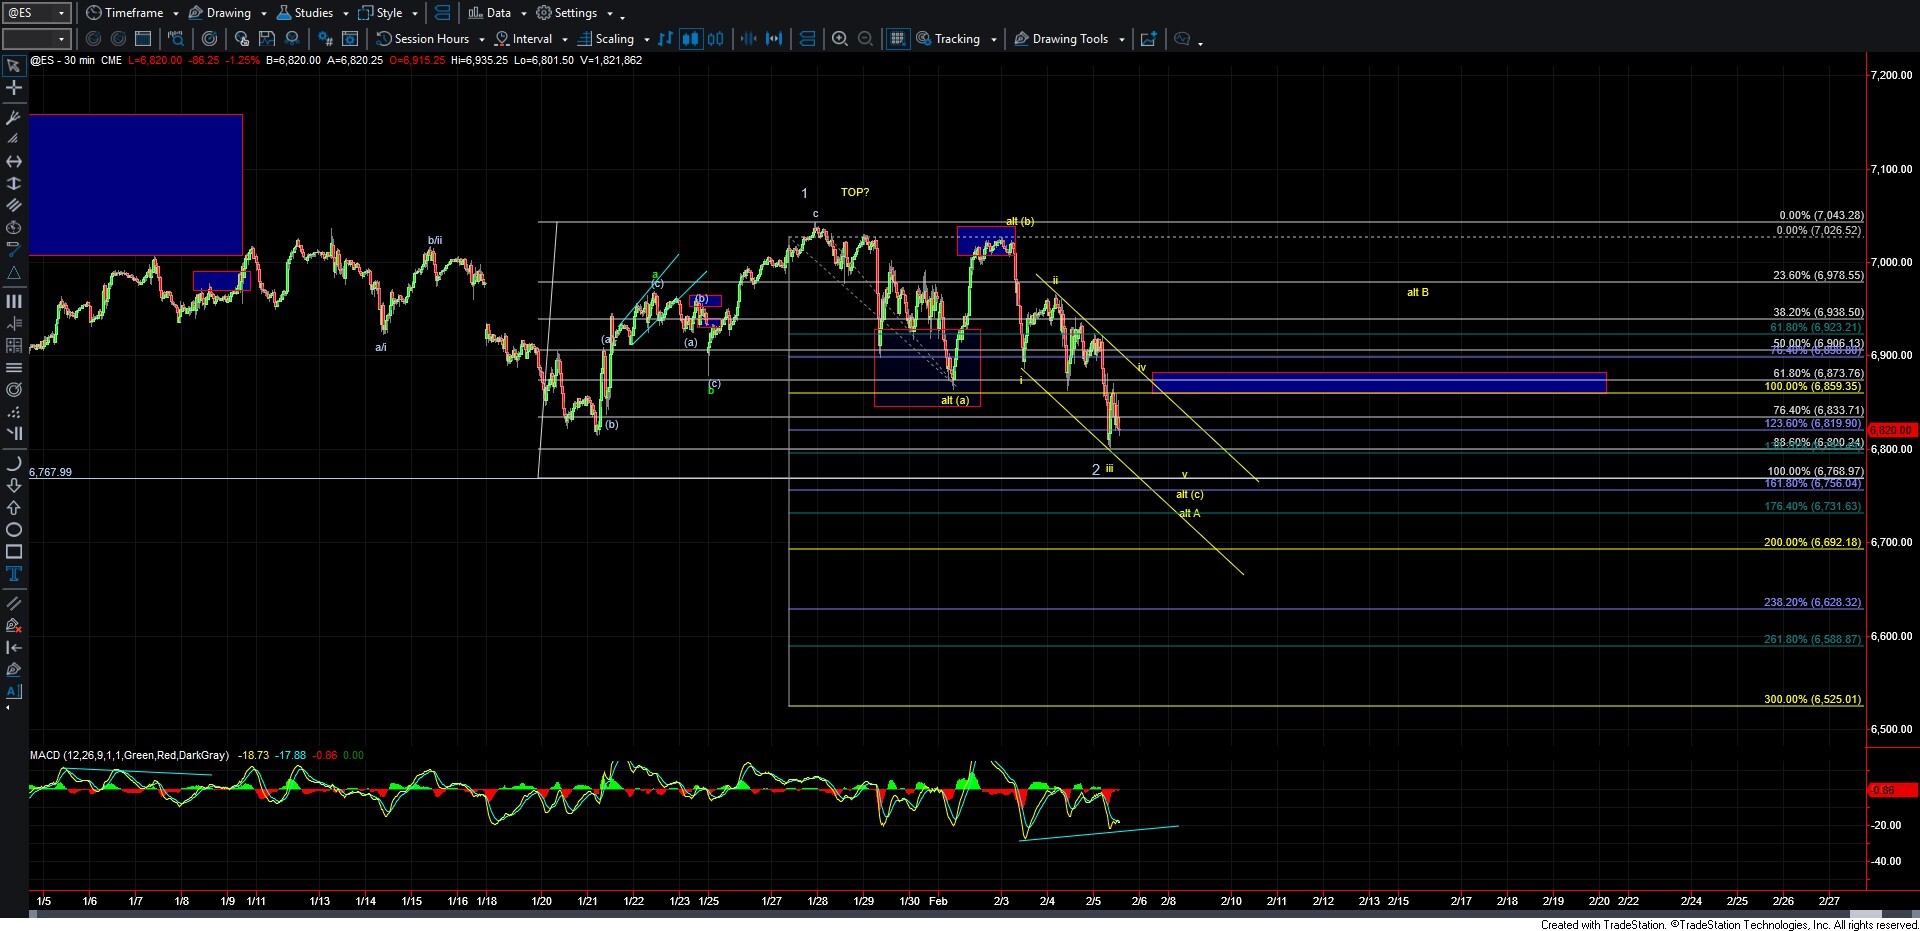
Today the market continued to push lower, breaking down below the first key support/pivot level that had been holding the bullish case for new all-time highs. With that said, the structure of the decline from the 7026 high is very overlapping and lacks an impulsive wave structure, which is more characteristic of corrective price action.
Importantly, there is still one key price level just below current levels that could hold and keep the bullish path to new highs intact. Because the wave action into current levels is corrective and overlapping, even if a larger top is already in place, I would still expect the potential for a push slightly lower followed by a retrace higher before the heart of the next leg down begins. If current levels hold and we move higher without first putting in a lower low, the door would remain open for new all-time highs. That window, however, is narrowing, and the market will need to push higher sooner rather than later if it intends to make another run to the upside.
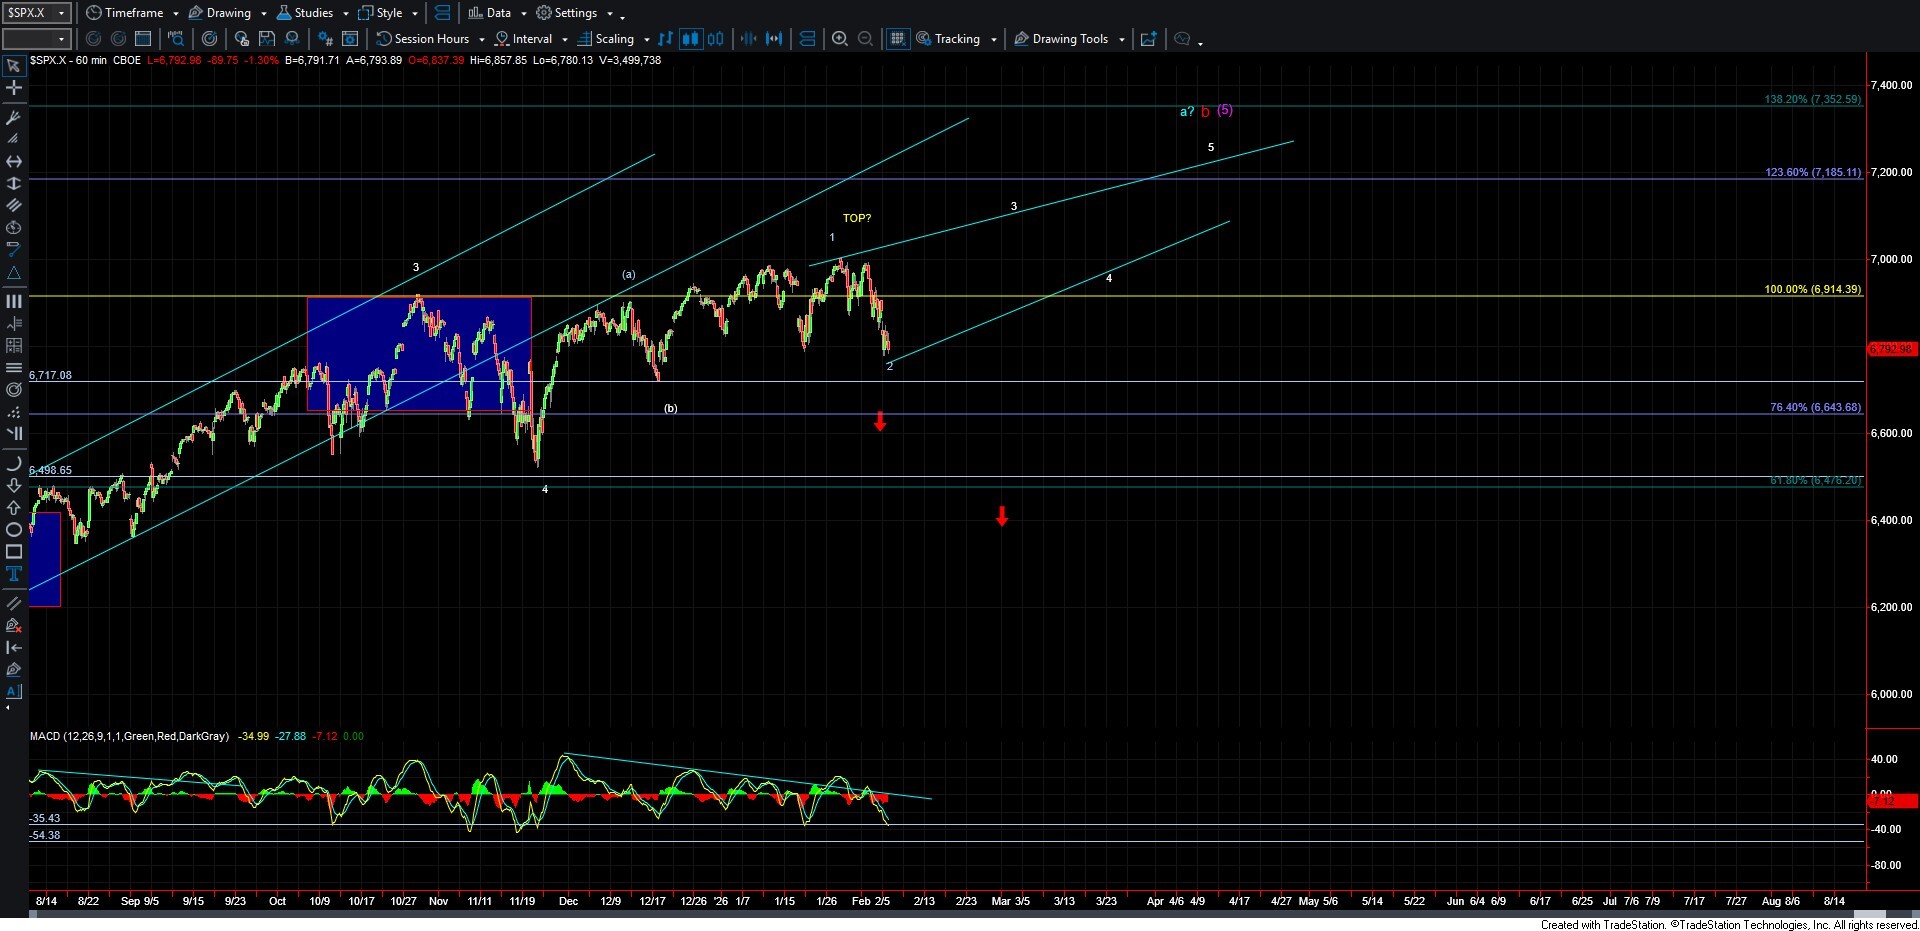
As shown on the ES chart, I am currently watching two counts, highlighted in white and yellow. The white count suggests we may be attempting to bottom in wave 2 of a larger Ending Diagonal off the December low. Under this scenario, price must hold above the 6767 level. A break below that level would invalidate this path. If we are indeed bottoming in this white wave 2, we would then need to see a move back above 6900 to provide initial confirmation that a local bottom is in place. That move higher would not necessarily need to unfold as a five-wave move, as we would still be trading within the context of a larger Ending Diagonal. The subsequent pullback would then help provide further clarity as to which path the market is following.
If the 6767 level breaks before we see a push higher, the yellow count would become the primary count. As noted above, due to the overlapping structure from the 7026 high, this would suggest we are likely working through a (c) wave of a larger wave A, which would mark the beginning of the next leg lower. While that would imply further downside before finding a bottom in wave A, we should be approaching the latter stages of that initial wave A. In that case, I would expect to see a wave B retrace before a more sustained and impulsive break lower in wave C. Additionally, if the (c) wave of wave A completes as an Ending Diagonal, the initial reversal higher is likely to be sharp before rolling over once again.
For now, we will wait to see how the market reacts at the key pivot levels just below current prices and monitor price action over the next couple of trading sessions. That reaction should provide greater clarity as to whether a larger-degree top is already in place or if this market still has enough momentum for another push to new highs. In either case, caution remains warranted, as we are still very extended on the larger-degree timeframes and the market has not experienced a meaningful pullback in quite some time.