Market At Next Inflection Point After Finally Breaking Down
 By
By
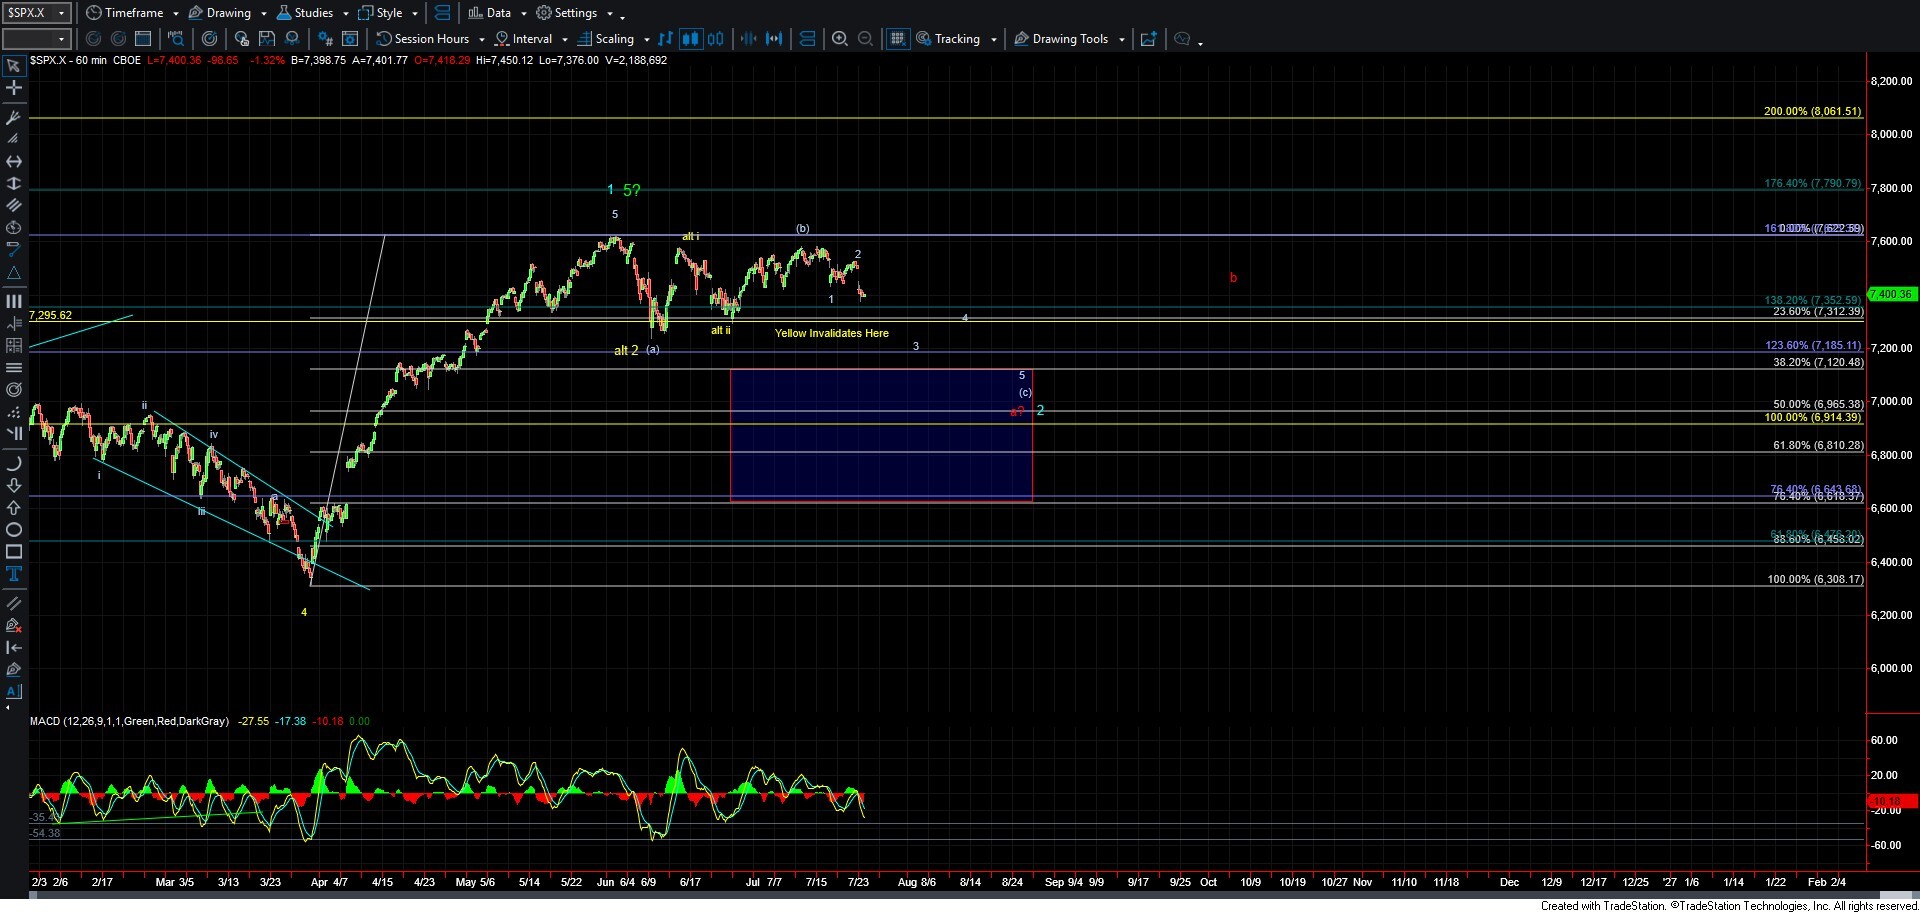
After taking the long road and making us wait for the expected break lower, the market is now sitting at the next key pivot/inflection point to the downside. If we can break through this region, it would provide further confirmation that we are indeed following the primary white count lower as part of the larger wave 3 of (c) down.
With that said, until we see a break of this next pivot level, I still cannot fully rule out the yellow count. I will note, however, that today's breakdown has made that path even less probable than it has been over the past several weeks. But in what has been a very sloppy and far from reliable market, I cannot completely rule out the bullish alternative until we officially invalidate that count.
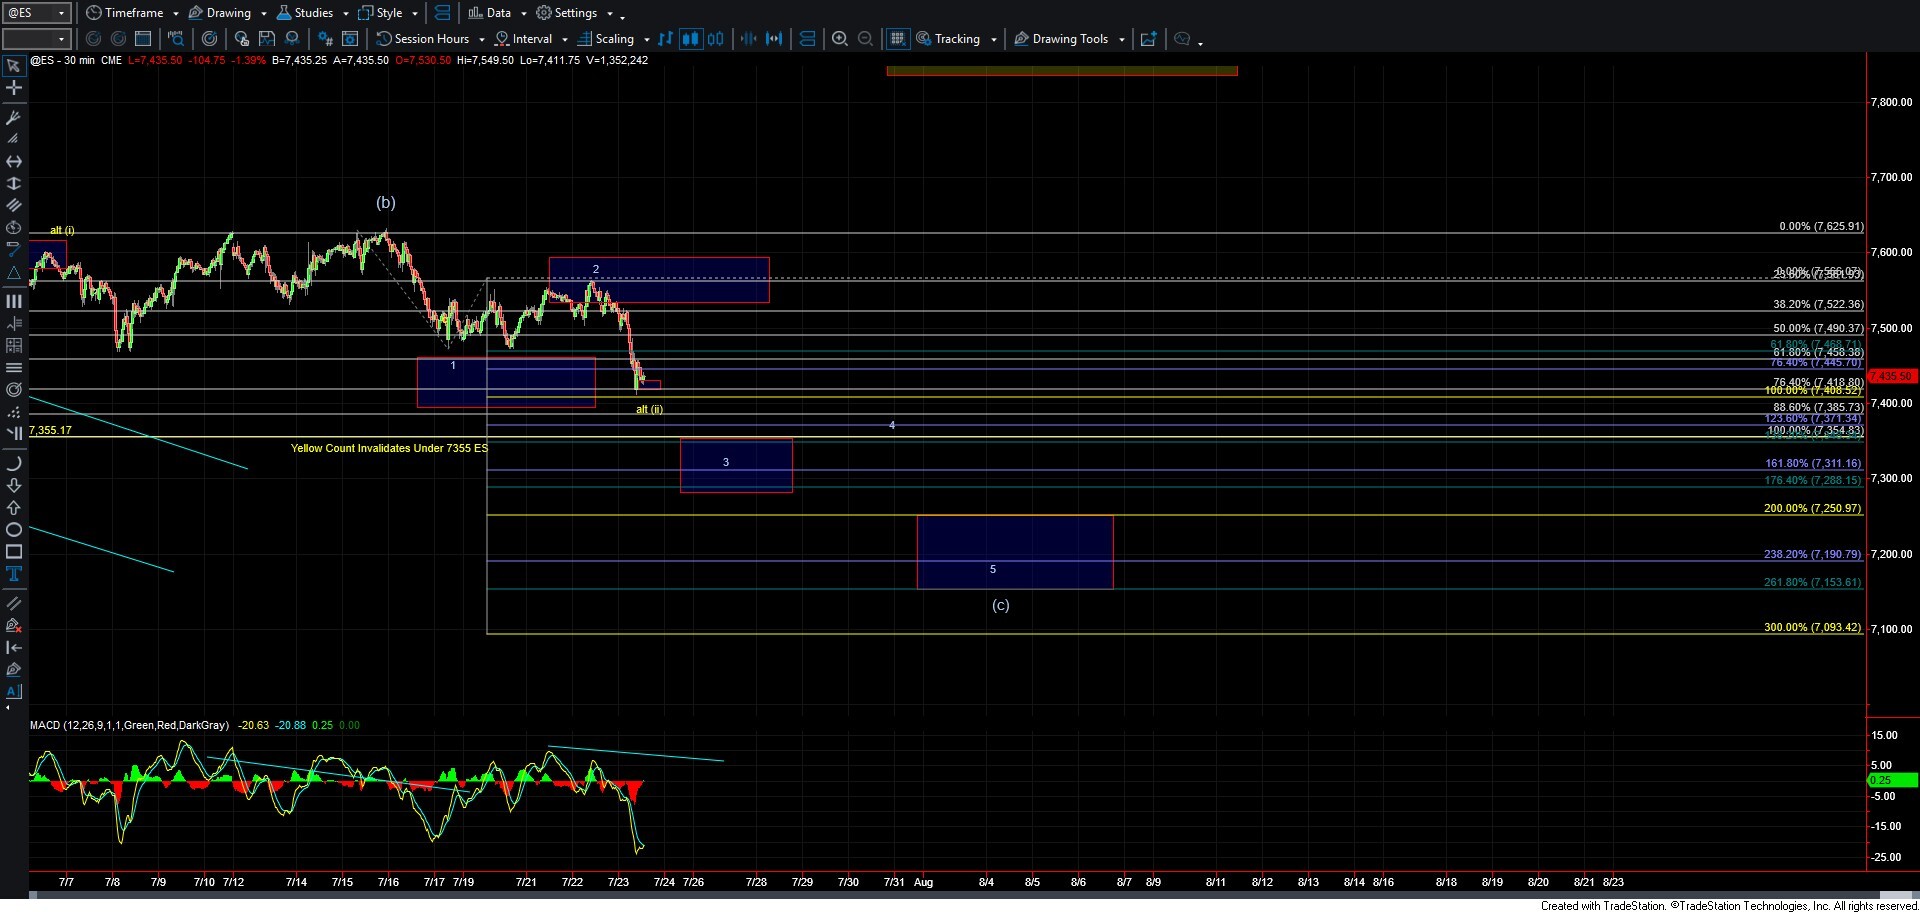
As shown on the ES chart, we reached the 100% extension at the 7408 level today around the 12:00 p.m. hour. Since then, we have retraced higher and are now pushing lower once again. Both the move up and the move back down have been far from clear and remain quite sloppy on the very small time frames, which is not giving us much to work with from a wave-count perspective. Because of that, I am going to focus on the more important larger-degree pivot levels based on our Fib Pinball guidelines, using the move down off the 7625 high as the reference.
If we are going to continue directly lower in wave 3 of (c) down from that 7625 high, our Fib Pinball guidelines suggest that we should hold below the 7468 level on any retracements, then break back below the 7408 level, followed by a continuation through the 7355 level. That would keep us on track to reach the 7355-7288 target zone for the white wave 3, which should then be followed by a wave 4 retracement and one final push lower in wave 5 of (c) toward the 7250-7153 target zone.
If we break back above the 7468 level before making another move lower, then we will need to keep a very close eye on the structure of that rally. If the move higher unfolds in five waves, it would open the door for the yellow wave (ii) to have already bottomed, with further confirmation coming on a break back above the 7567 high.
If, however, we break above 7468 on a three-wave rally, then it would open the door for wave (c) down to be developing into an Ending Diagonal to complete the pattern to the downside. We would still need additional downside follow-through to confirm that pattern, but it is now on my radar if we continue to see a corrective move higher.
For now, we simply need to wait and see how the market reacts at the current pivot level below and the resistance level overhead. That should tell us whether the market is taking the scenic route lower, the direct route lower, or intends to cross the double yellow lines and make a U-turn in the middle of the highway.