Market At Another Key Inflection Point On The Smaller Timeframes
 By
By
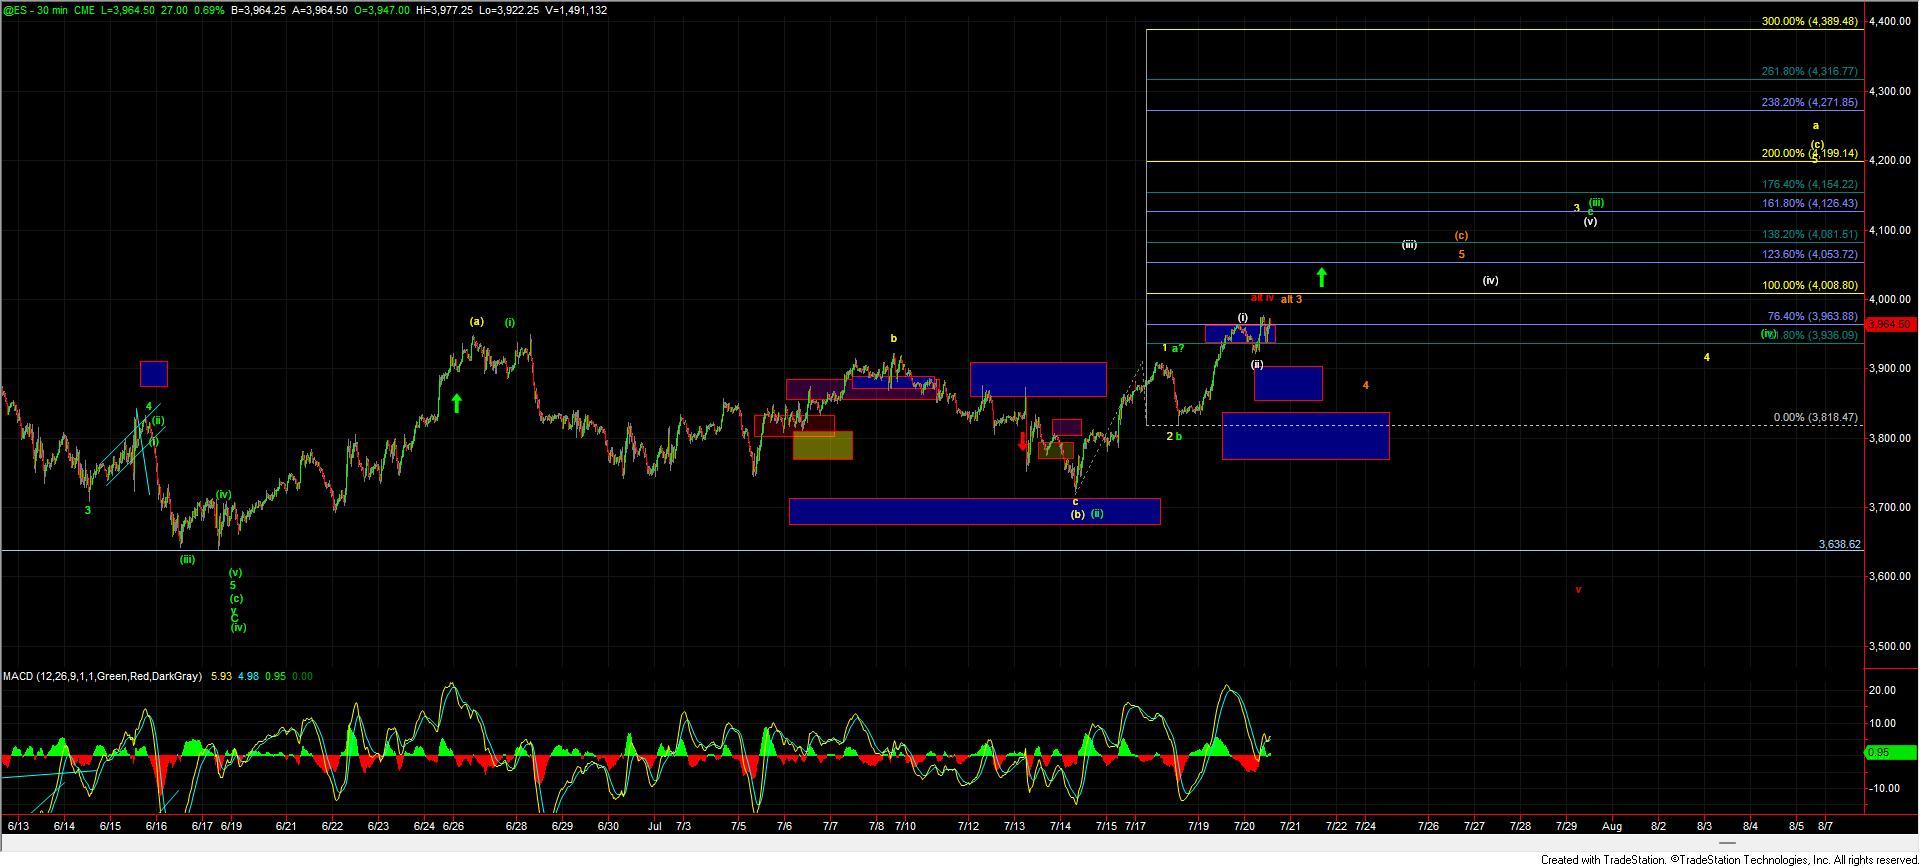
Today the market pushed higher and then retrace lower after the open and has since moved higher once again. We have been trading around our key pivot zone at the 3936-3963 zone most of the day but have yet to break out over it or see a sustained break below it. We are also trading under the 100ext of the initial move up off of the lows at the 4008 level which is leaving the market at a fairly key inflection point on the smaller timeframes. Unfortunately is leaving the door open to a number of possible paths on the smaller timeframes but this should resolve in the next day or so at which point we can remove some of these possible paths. The parameters are fairly well defined however and I will do my best to lay those out.
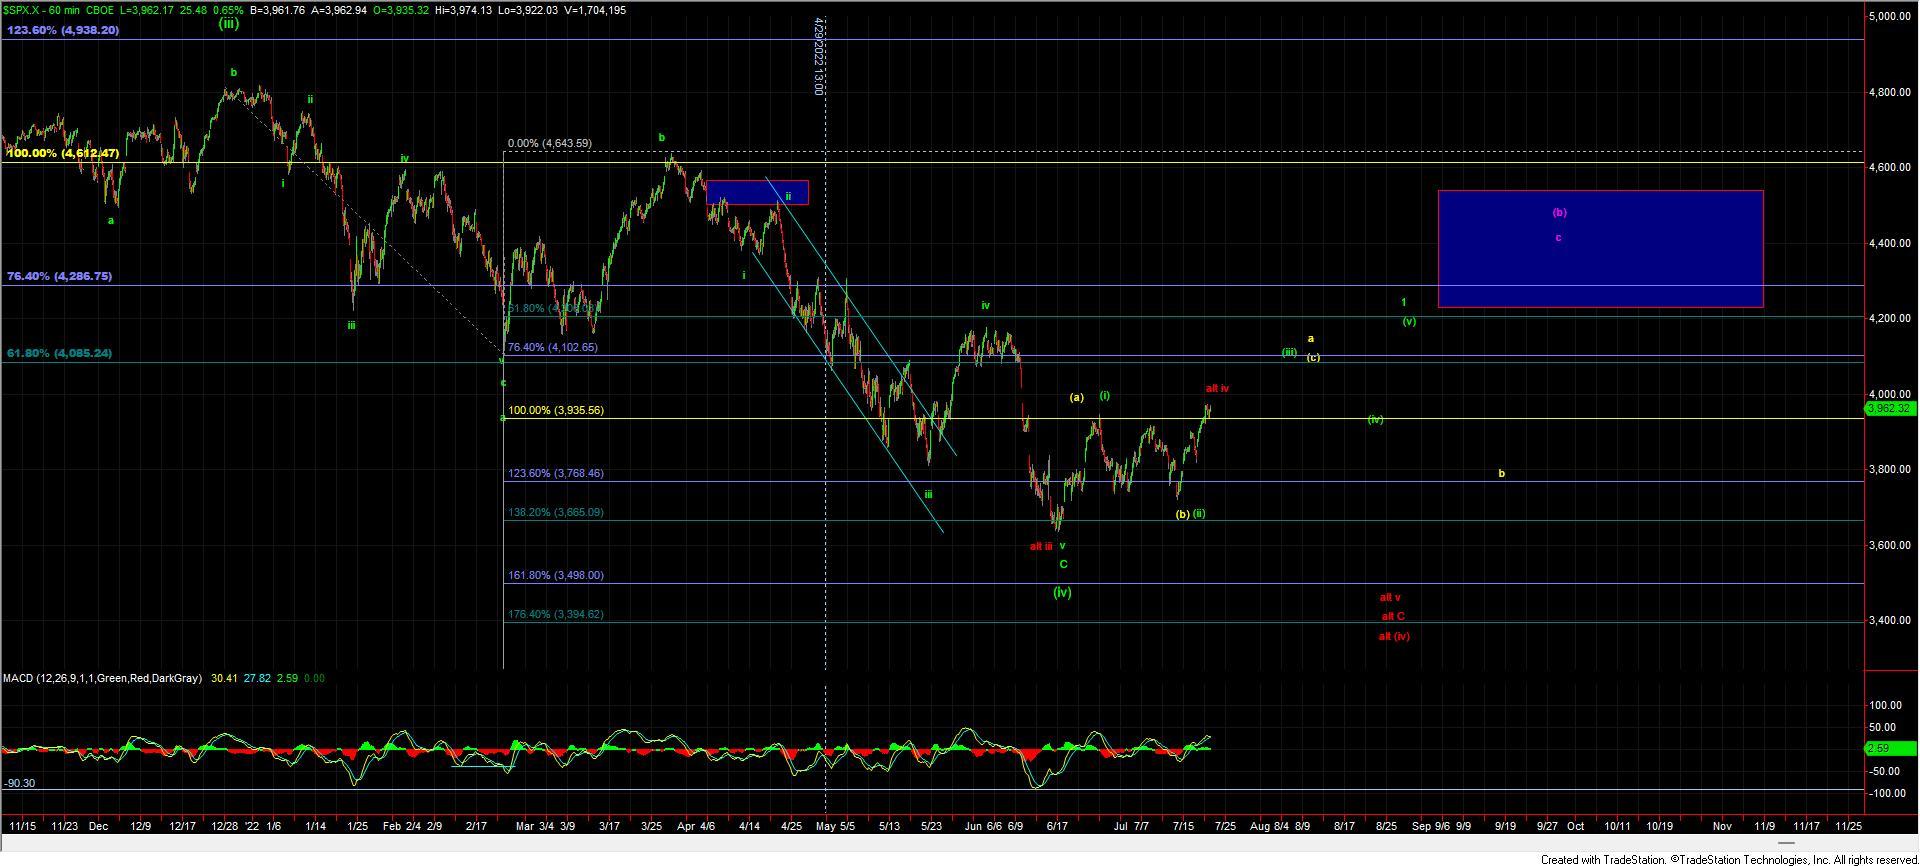
Bigger picture very little has changed since yesterday and I am still watching the yellow, green and red counts as shown on the 60min chart. Again as far as that chart is concerned nothing has changed since yesterday and the analysis remains the same. The smaller degree timeframes as noted above are at a fairly key spot here and what this does over the next couple of trading sessions will help give us further guidance into the weeks ahead
Yellow Count
As I noted yesterday the yellow count is suggestive that we are in the wave 3 of (c) of the larger wave a up off of the lows. What is still a bit unclear is wheree that wave 3 will actually top. Because the entire move up off of the 7/14 low is likely a diagonal under this yellow count the entire substructure should take the form of ABC corrective wave action. This type of action is less reliable than when we are dealing with impulsive wave action and therefore allows for more variable paths to be taken. Further complicating things is that we did not see a proper retrace for the potential wave (ii) after hitting the pivot zone overnight thus making the 100ext at the 4008 level even more important. So with that I now have to allow for the wave 3 of this yellow count to have a potential top at the 4008 region under which case we should see a pullback towards the 3900-3850 zone which should then be followed up with another wave 5 up to finish off the wave (c). This path is shown in orange but is a variant of the yellow count. If we push directly higher through the 4008 level then it still would leave the door open to seeing a larger wave 3 targeting the 4081-4126 zone before seeing that retrace for the wave 4. So again 4008 is quite key in determining whether we see more of a direct break higher towards that 4100 region or whether we see a pullback occur first.
Green Count
The green count is almost identical to the yellow count at this point in time and as I noted above but we need to get through that 4008 level. If we fail at that spot then we are likey dealing with the orange variant of the yellow count. If we do breakout above the 4008 level then we still really won't know which path we are following (yellow or green) until we top out near the 4081-4126 zone overhead and I will layout the parameters if and when we get to that zone.
Red Count
The red path would suggest we are topping in a wave iv and still needing another lower low for a wave v as Avi had laid out in his weekend update. I am not viewing this path as highly probable at this point in time but will leave it on the charts for the time being. I would need to see a break back under the 3818 level to suggest that we may have topped in this red count and unless and until that occurs the near-term pressure will remain up per the yellow/green counts as described above.
So while today's action has not changed much on the bigger picture path the micro pattern is still quite key here and what happens over the next couple of sessions is really going to help let us know whether we have another week of fairly clear and predictable price action or whether things will get a bit more difficult and choppy. Either way we likely are just about done with the easy part of this move and things are likey to get a bit more complex as we move into the various degrees of the fourth and fifth waves of this price action up off of the lows.