Market At A Key Inflection Point But Pressure Still Remains Down
 By
By
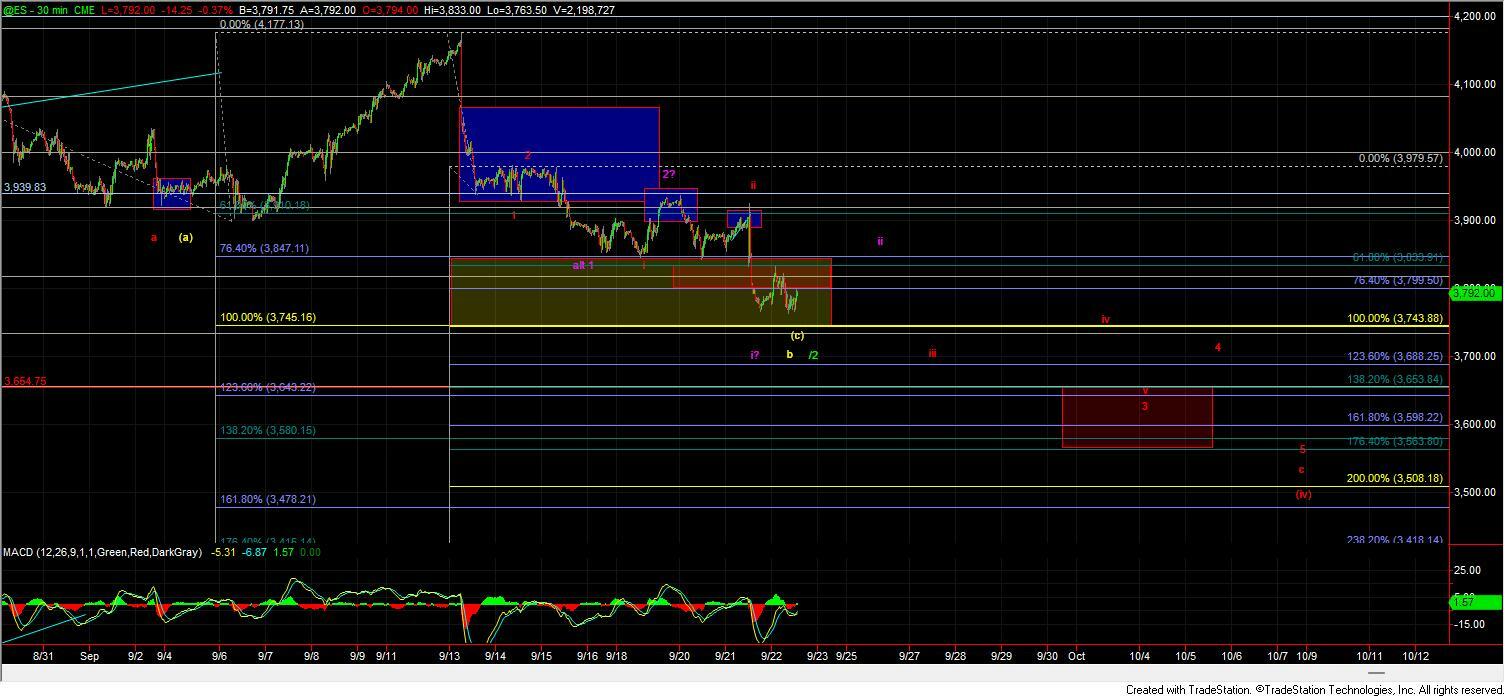
After seeing a sharp move down yesterday that then carried over into the after-hour session we say the markets attempt to push higher this morning only to break down once again to see lower lows. While the SPX held up better than the other indexes with the Russell 2000 Small Cap index being hit the hardest of the three trading down close to 2.5% at the lows. This continued push lower is still very much leaving the pressure to the downside with me still watching the red count as an impulse down off of the 4177 high as my primary path forward. I will note that the ES is at a very key inflection point with the next major pivot sitting just below at the 3745 level. This level has Fibonacci confluence of several degrees and if the market is able to push through this zone it would make any bullish resolution before a break of the June lows much less probable thereby giving us further confirmation that we are indeed following the red count down to new lows. If however, we are able to hold that region and see a strong reversal pushing back up over the 3940 level then the bullish counts do still have a chance here but this really is a very key spot for the bullish counts to hold for them to have a chance at becoming the operative path forward.
Red Count
Under this count, we should now hold the 3825-3864 zone overhead and then break back down below the lows that were struck today at the 3763 level. From there we then need to see a break of that 3745 pivot as noted above to give us further confirmation that we have indeed topped in the red count and are heading lower in the wave iii of 3 down. Moving through that level then opens the door to this seeing a fairly direct move down into the 3653-3563 zone for the wave 3 of c with the ultimate targets for the wave 5 of c closer to the 3508-3362 zone below. If we break back up over the 3864 level then it would open the door for this to have made a bottom in either the purple bearish count or potentially a larger bottom per the wave b/2.
Purple Count
I have modified this count which makes it ultimately a more bearish outcome than the red count. That said we could potentially see a retrace higher for a wave ii under this case before seeing that sharp drop lower. Under this case, I am now labeling the bottom of the wave 1 at the lows struck at the 3847 level with the wave 2 having topped at the 3939 level just overhead. This would put the current move into the 3763 low as part of a wave i of larger 3 with any retrace higher being a wave ii of that 3. This woudl ultimately move deeper than the red count as the initial wave 1 would be larger than the red count but again we may see a deeper retrace higher for the wave ii of 3 before any breakdown under this case. I am still viewing this as an alternate count at this point in time but should we move lower I will keep a closer eye on the fibs and if we begin to trace out the fibs per this path I will layout the downside targets at that time.
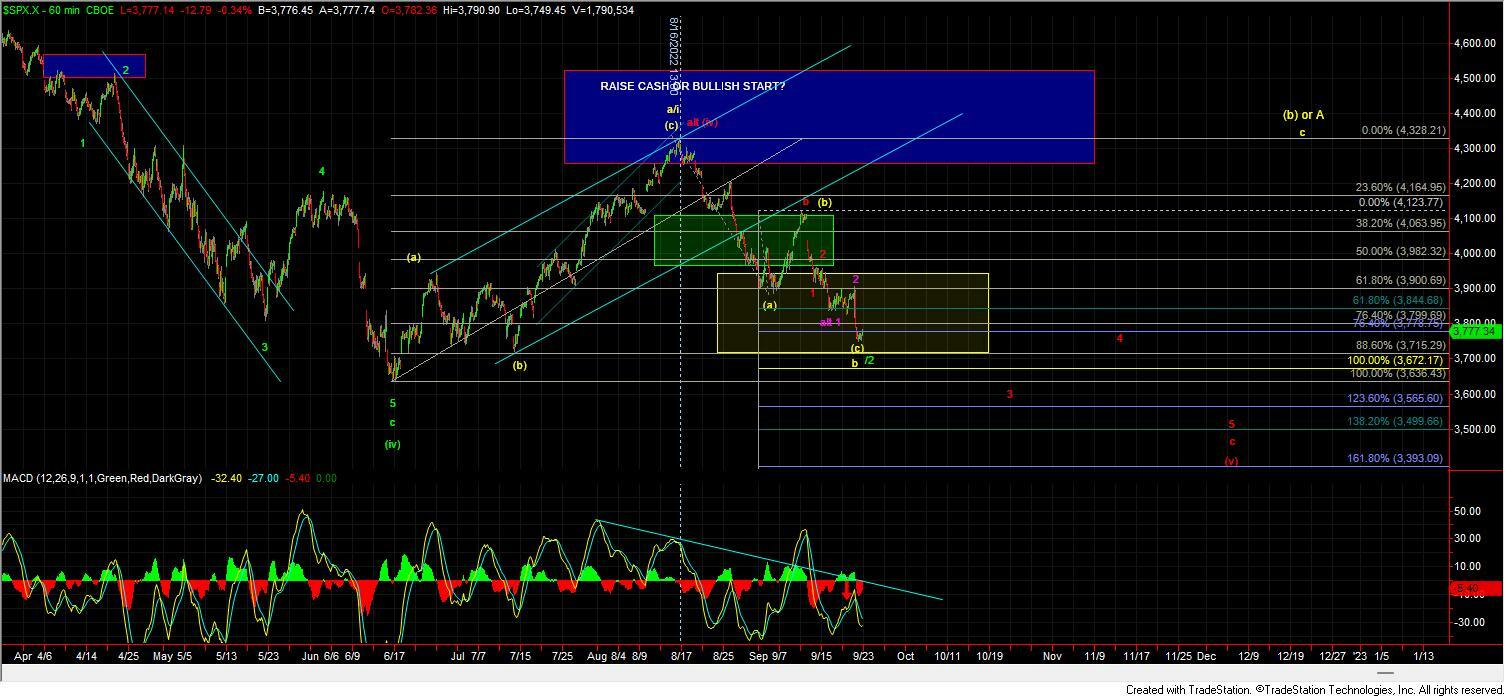
Green/yellow count
The green and yellow counts are going to trace out very similarly in the early stages and it will be tough to differentiate them which is why I am combining them into one narrative for the time being. Under this case, we should move back up over the 3979 high and then ultimately back over the 4135 level on its way back up over the highs that were struck in August. That move would then either be the start of a wave iii as part of a diagonal to new highs under the green path or as part of a larger wave (b) as I am showing in yellow. Again the early part of this move is likey to be similar so at this point I am going to combine the narrative to try to keep things a bit more simple. Again holding 3745 on the ES is really going to be key for this count.
So while today was certainly quieter than yesterday the market has yet to relieve any pressure to the downside count but with the hold over the 3745 level for the time being we will have to wait into tomorrow to see if we are going to see direct downside resolution or whether the bulls are going to be able to make stand here and attempt to hold this and push the markets higher.