Market Answered Our Questions
Yesterday, we were left with a few questions regarding how the IWM and SPX will likely resolve. Today, the market seems to have answered those questions with a shortened drop -thus far – by IWM, and the SPX holding its support and starting a rally off support.
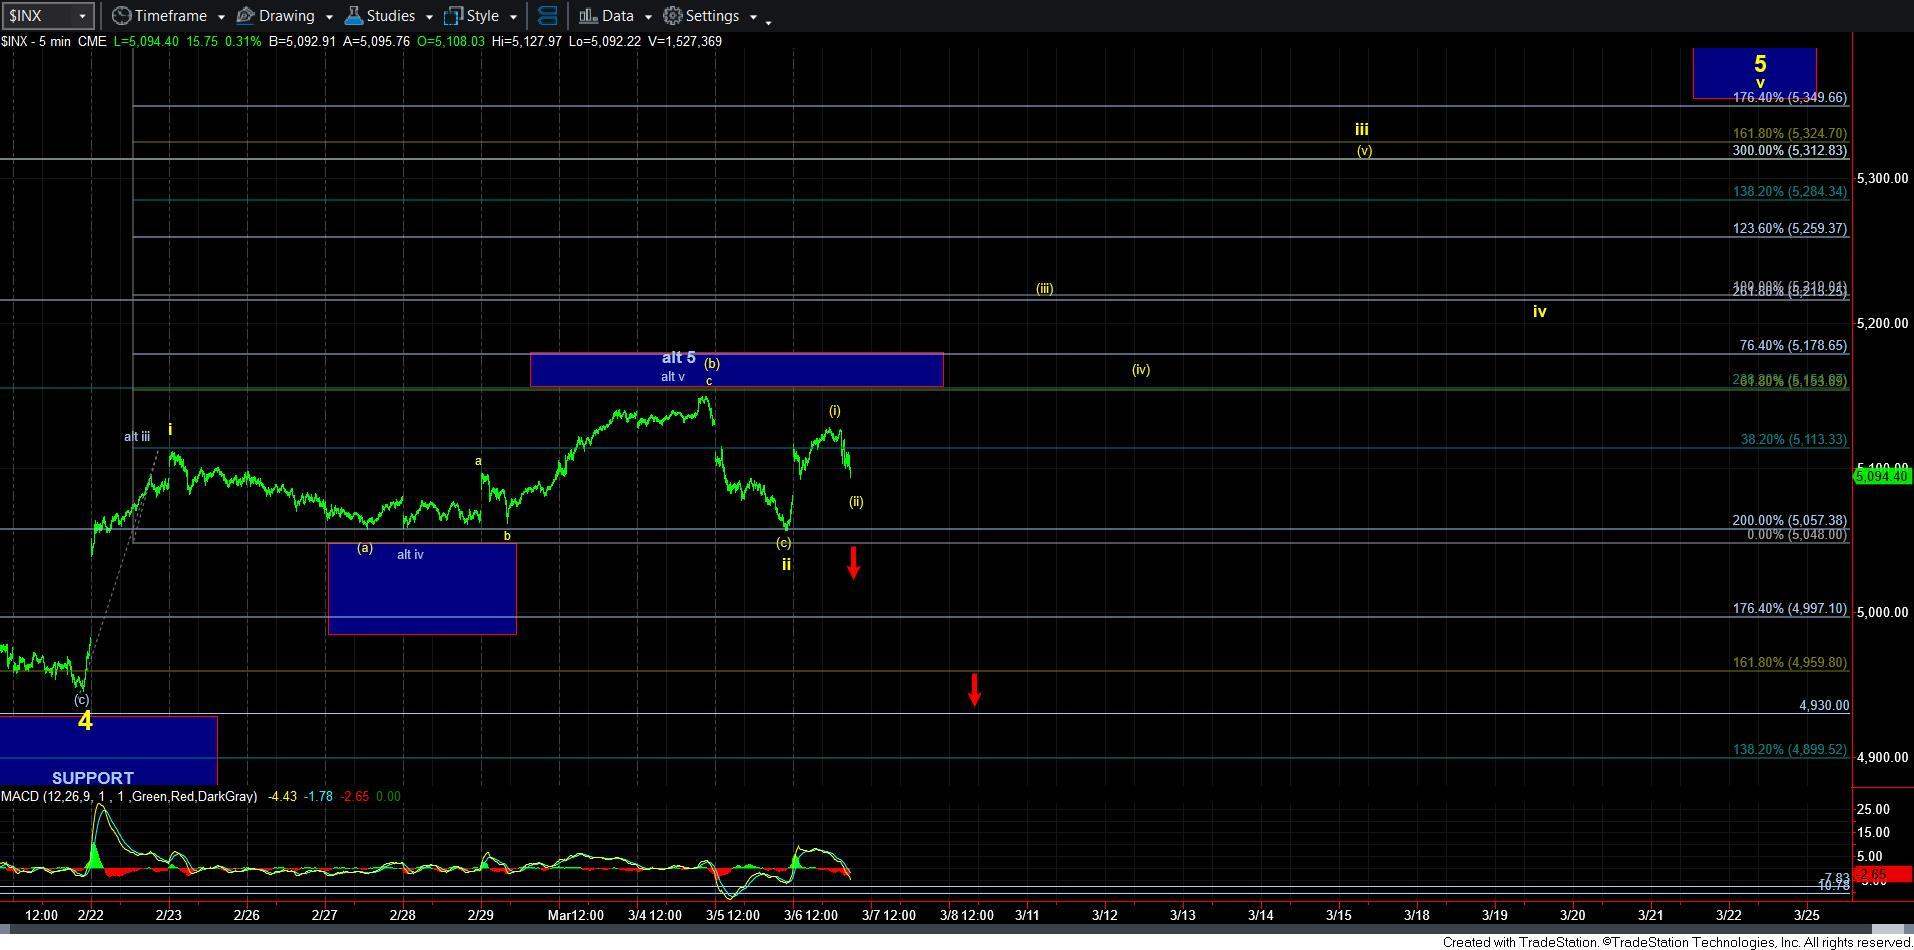
This brings me to a small modification in the wave count on the 5-minute chart, which I discussed in today’s live video to the general membership. I am viewing yesterday’s drop in the SPX as the [c] wave in an expanded wave ii flat. While the ES futures can still view yesterday’s drop as wave [ii], the SPX counts best as the expanded flat since the rally to resistance in SPX is better counted as 3-waves (even though the futures can be counted as 5), and the drop yesterday counted well as a 5-wave [c] wave structure.
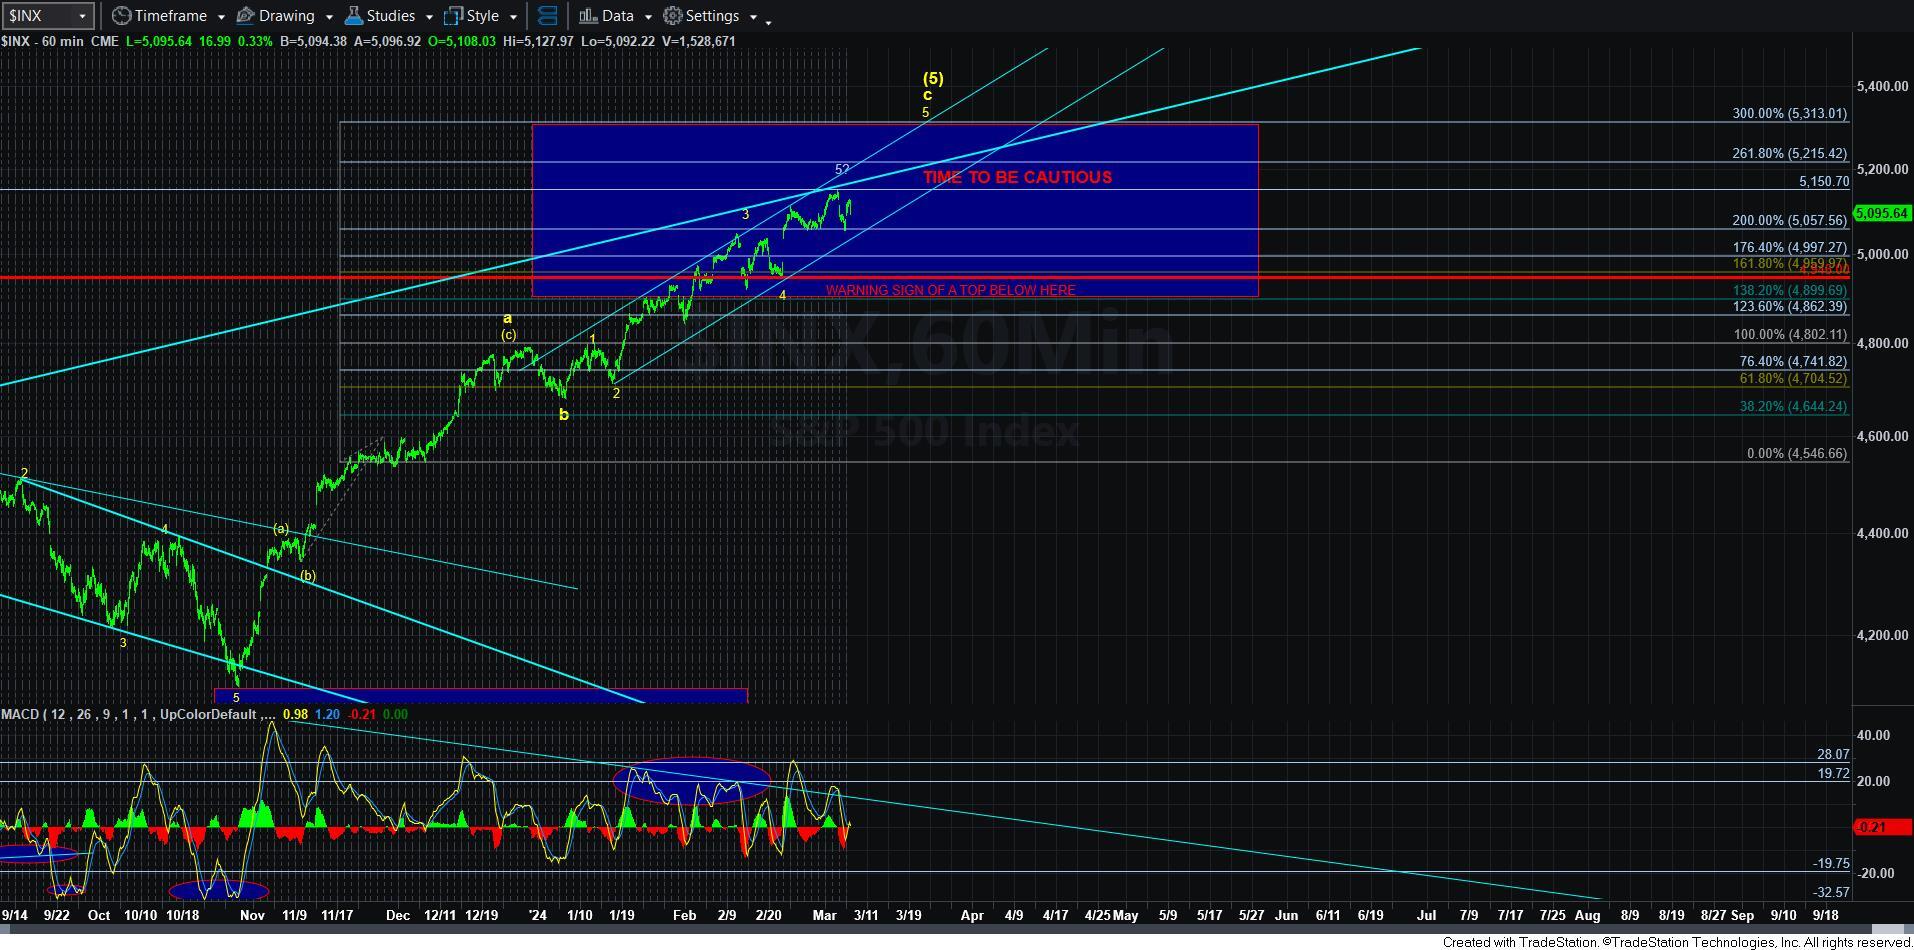
But, I really think this is somewhat academic at this point. The main point is that as long as we hold over yesterday’s low, we now have a set up pointing us to the 5350+ region over the coming weeks.
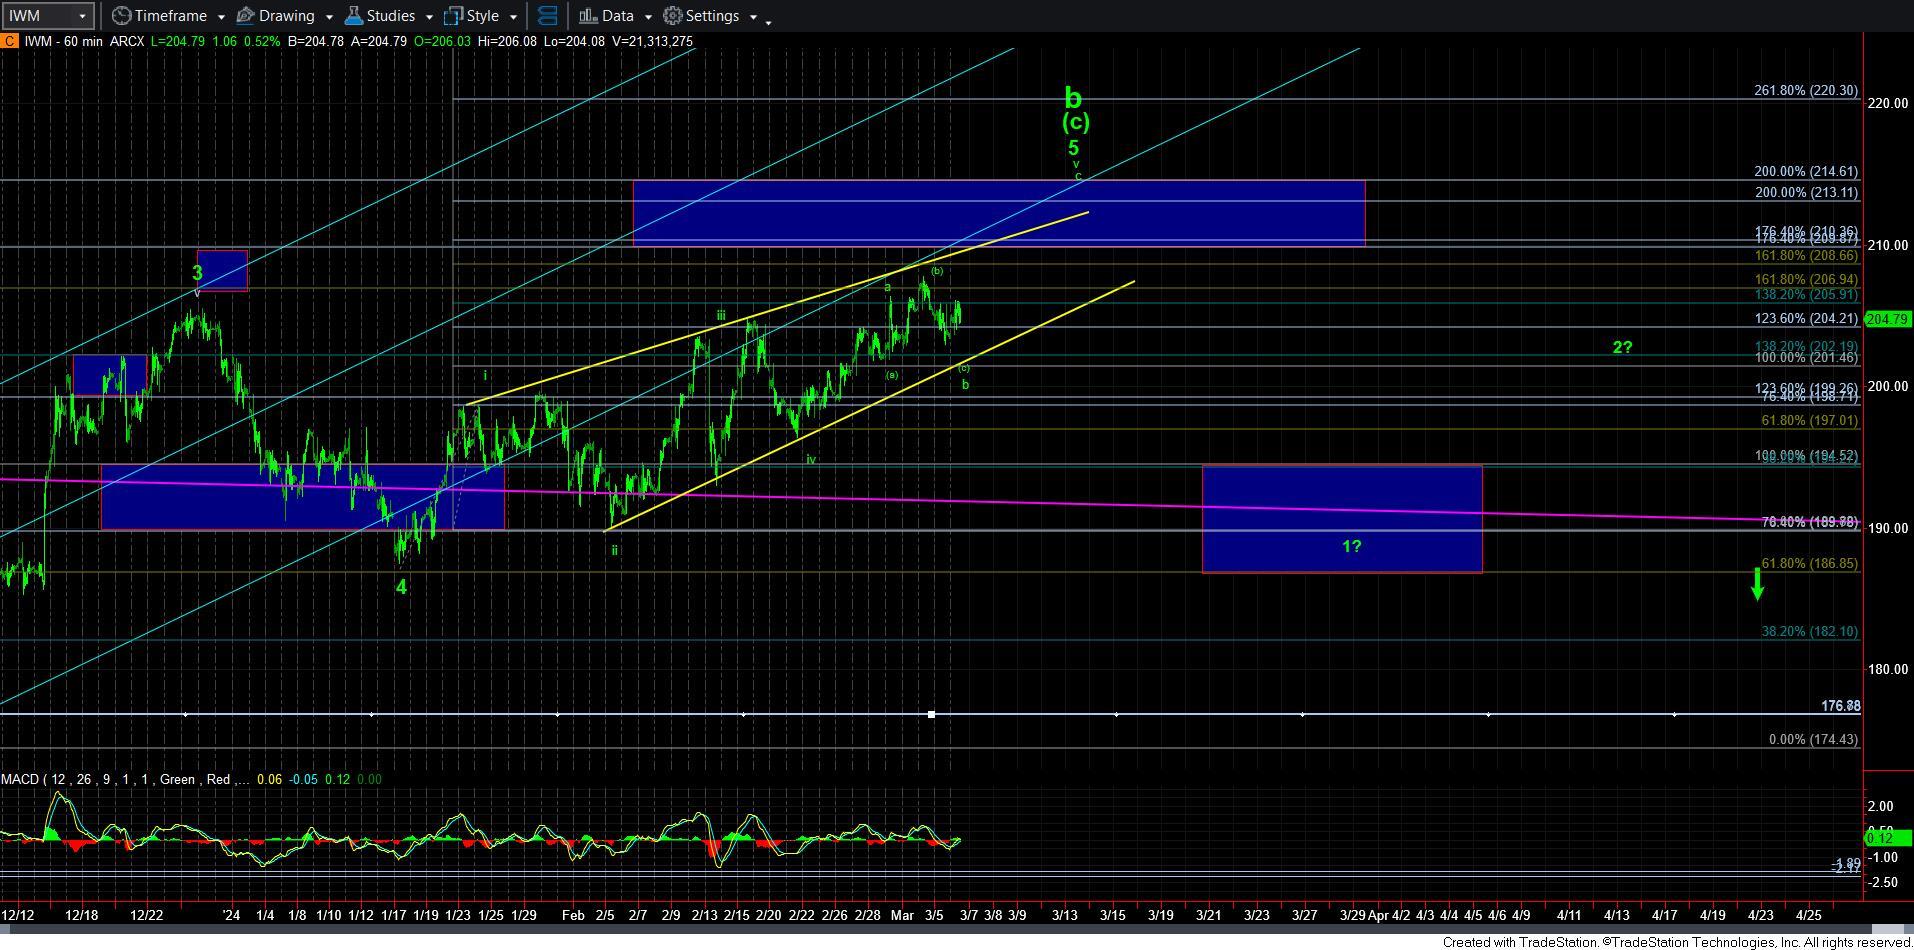
In the IWM, we clearly has a more amorphous structure taking shape before we rally up to the 209+ region to complete the c-wave of wave v. And, I am assuming that the c-wave rally will likely accompany the wave 5 rally in the SPX over the coming weeks.
So, to keep this rather simple, as long as we remain over yesterday’s low in the SPX, and then rally through this week’s high, we will likely be pointing to the 5350+ region in the coming weeks. However, should the SPX break below yesterday's low, we have an initial indication of a potential top in place. And, a follow through below 4946SPX would likely confirm.
Lastly, I have said this before, and I will repeat it . . I would strongly advise all members to watch my Wednesday live videos - which are open to all full memberships - as they go through detail you may not always glean from the written word.