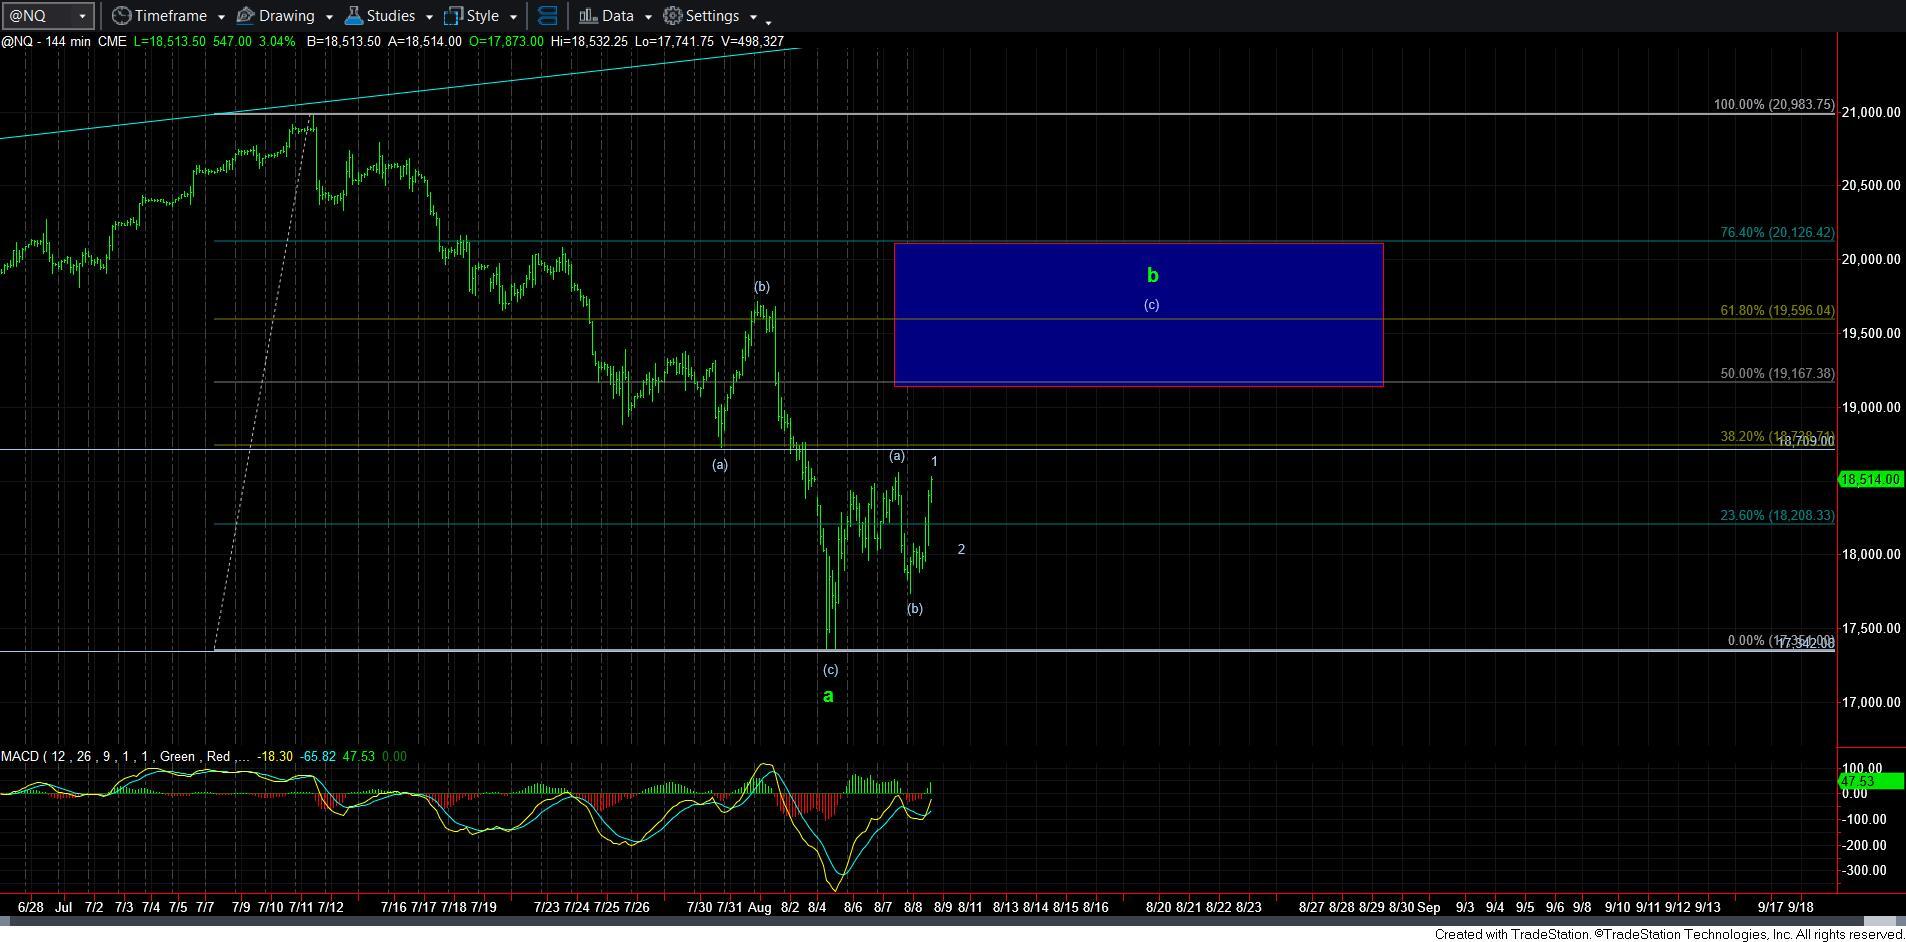
Making Our Way Higher To Resistance
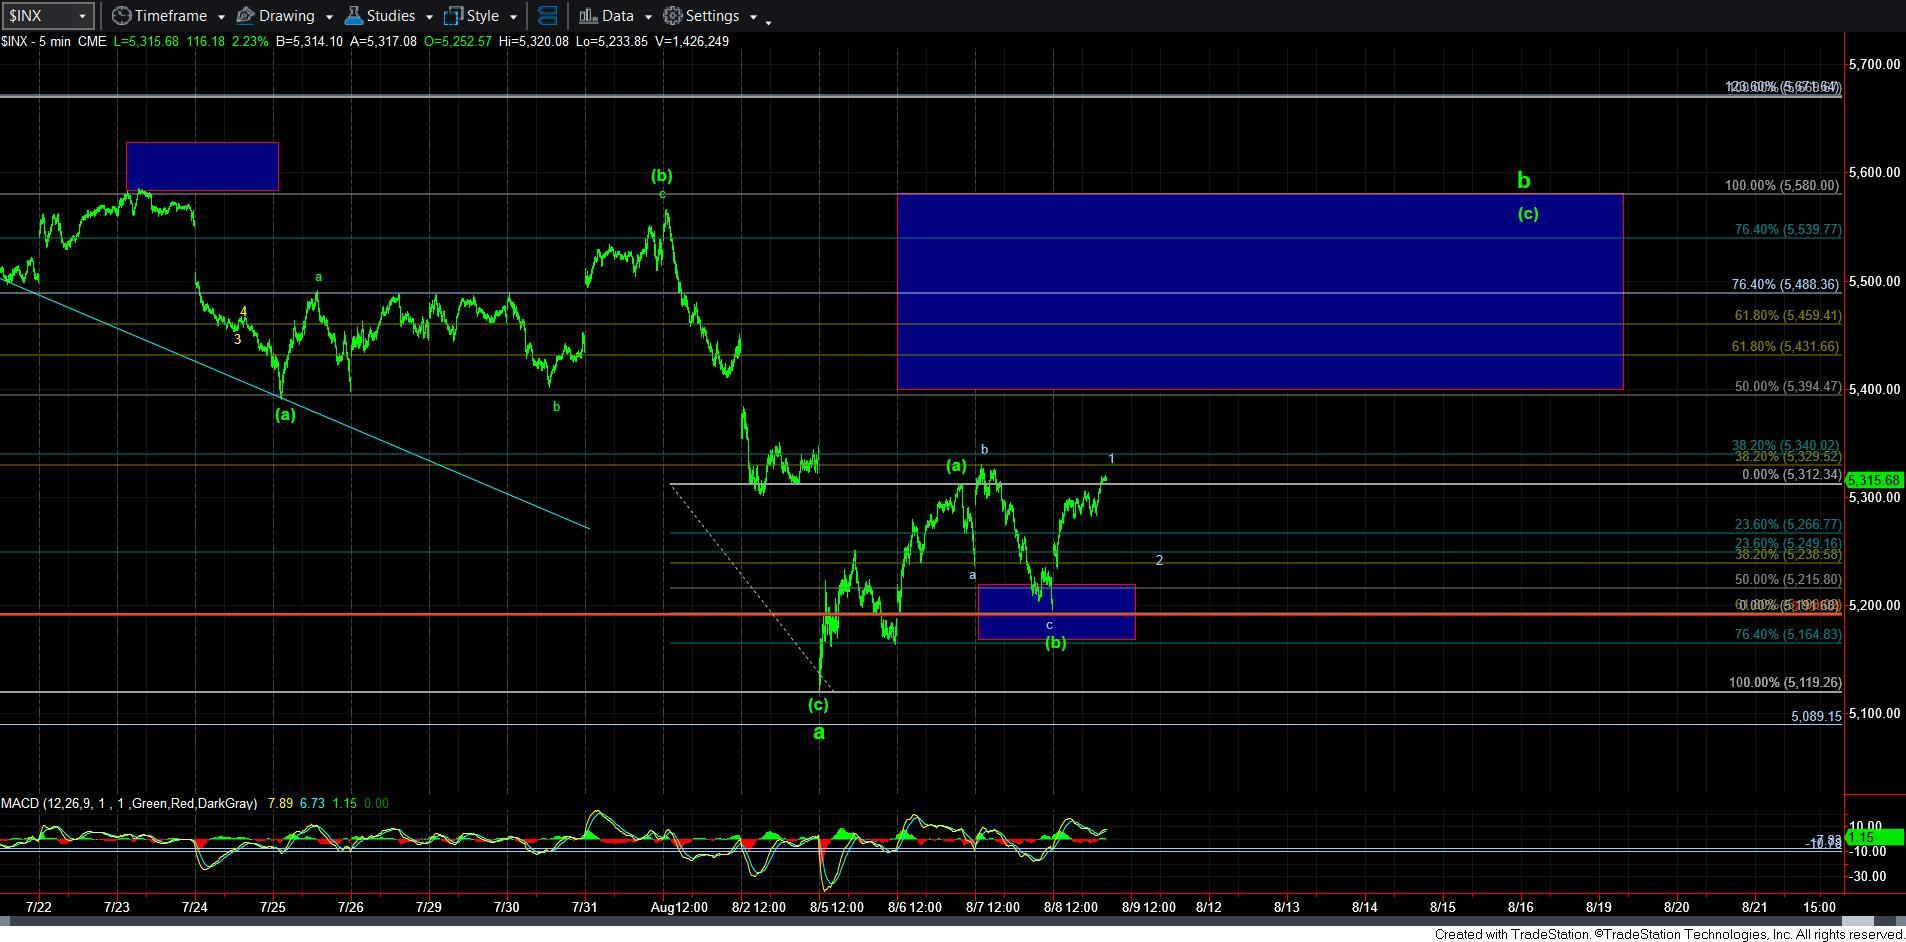
Thus far, the market has been acting relatively predictably and following the [a][b][c] structure we have been outlining since we bottomed days ago.
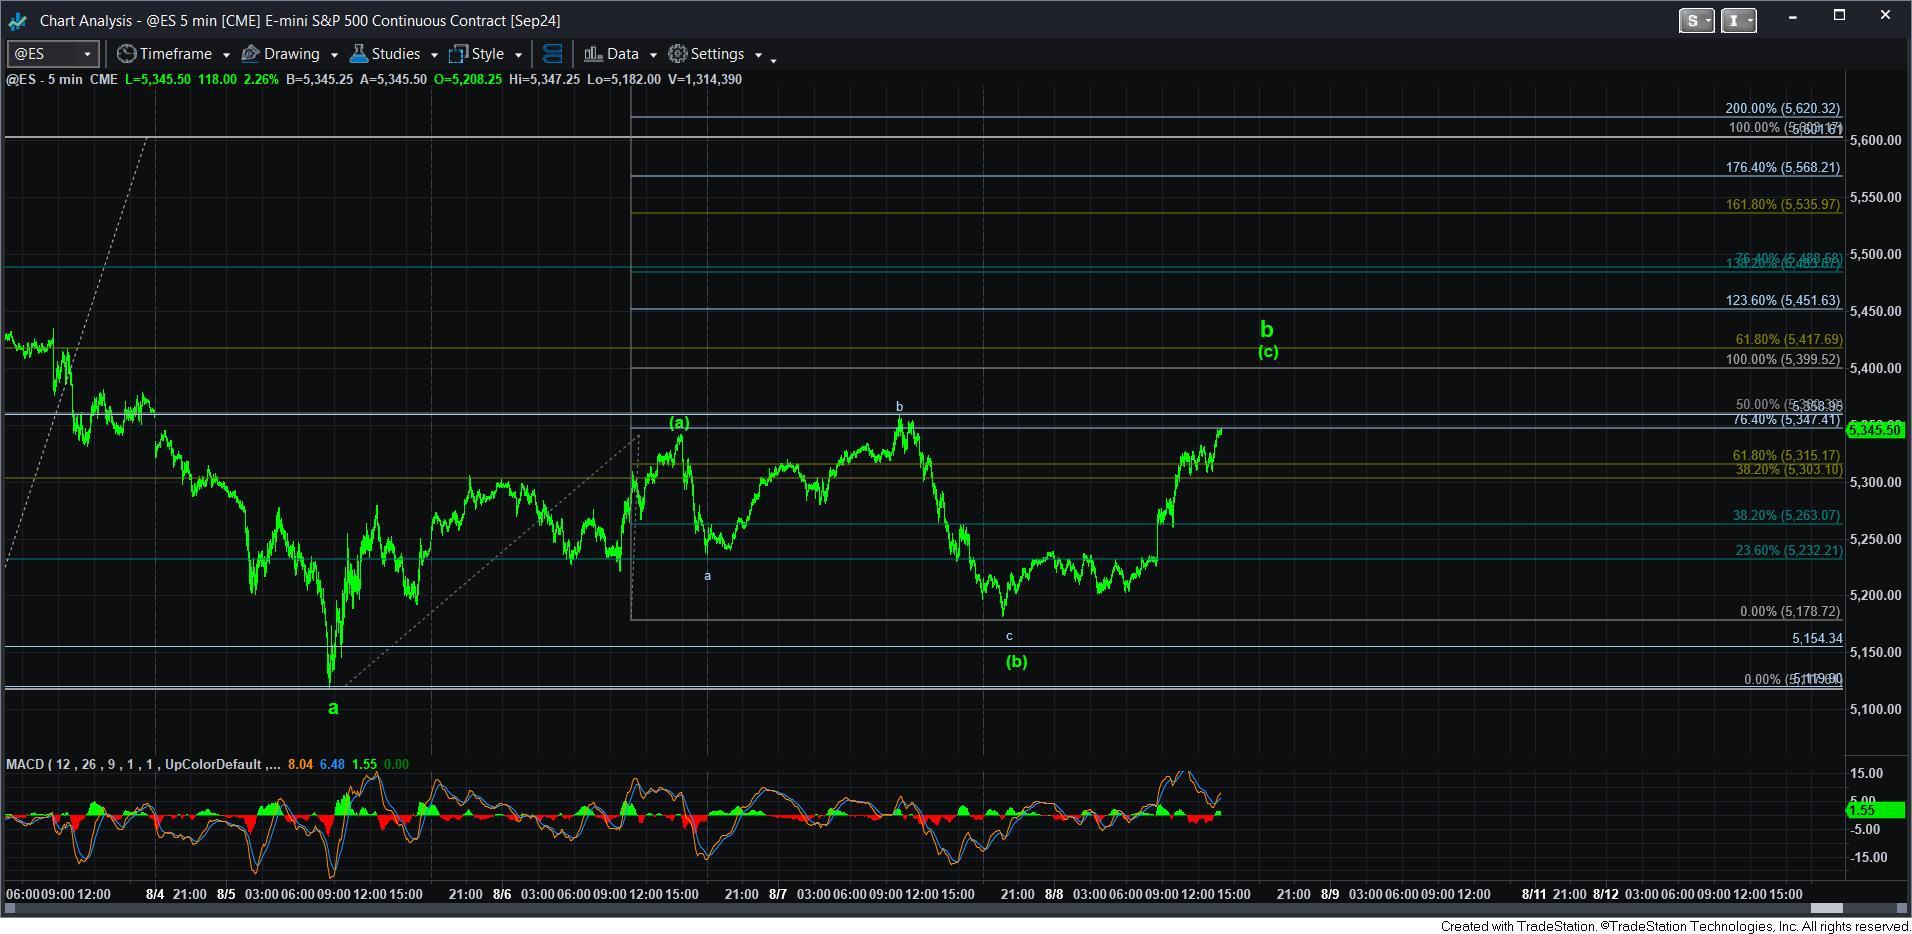
At this time, it seems that the [a] wave and the [b] wave of this rally have completed. And, I think the most likely path forward is that we are now completing wave 1 of the [c] wave. That means I am looking for wave 2 pullback, followed by waves 3, 4 and 5 to complete the [c] wave rally over the coming days.
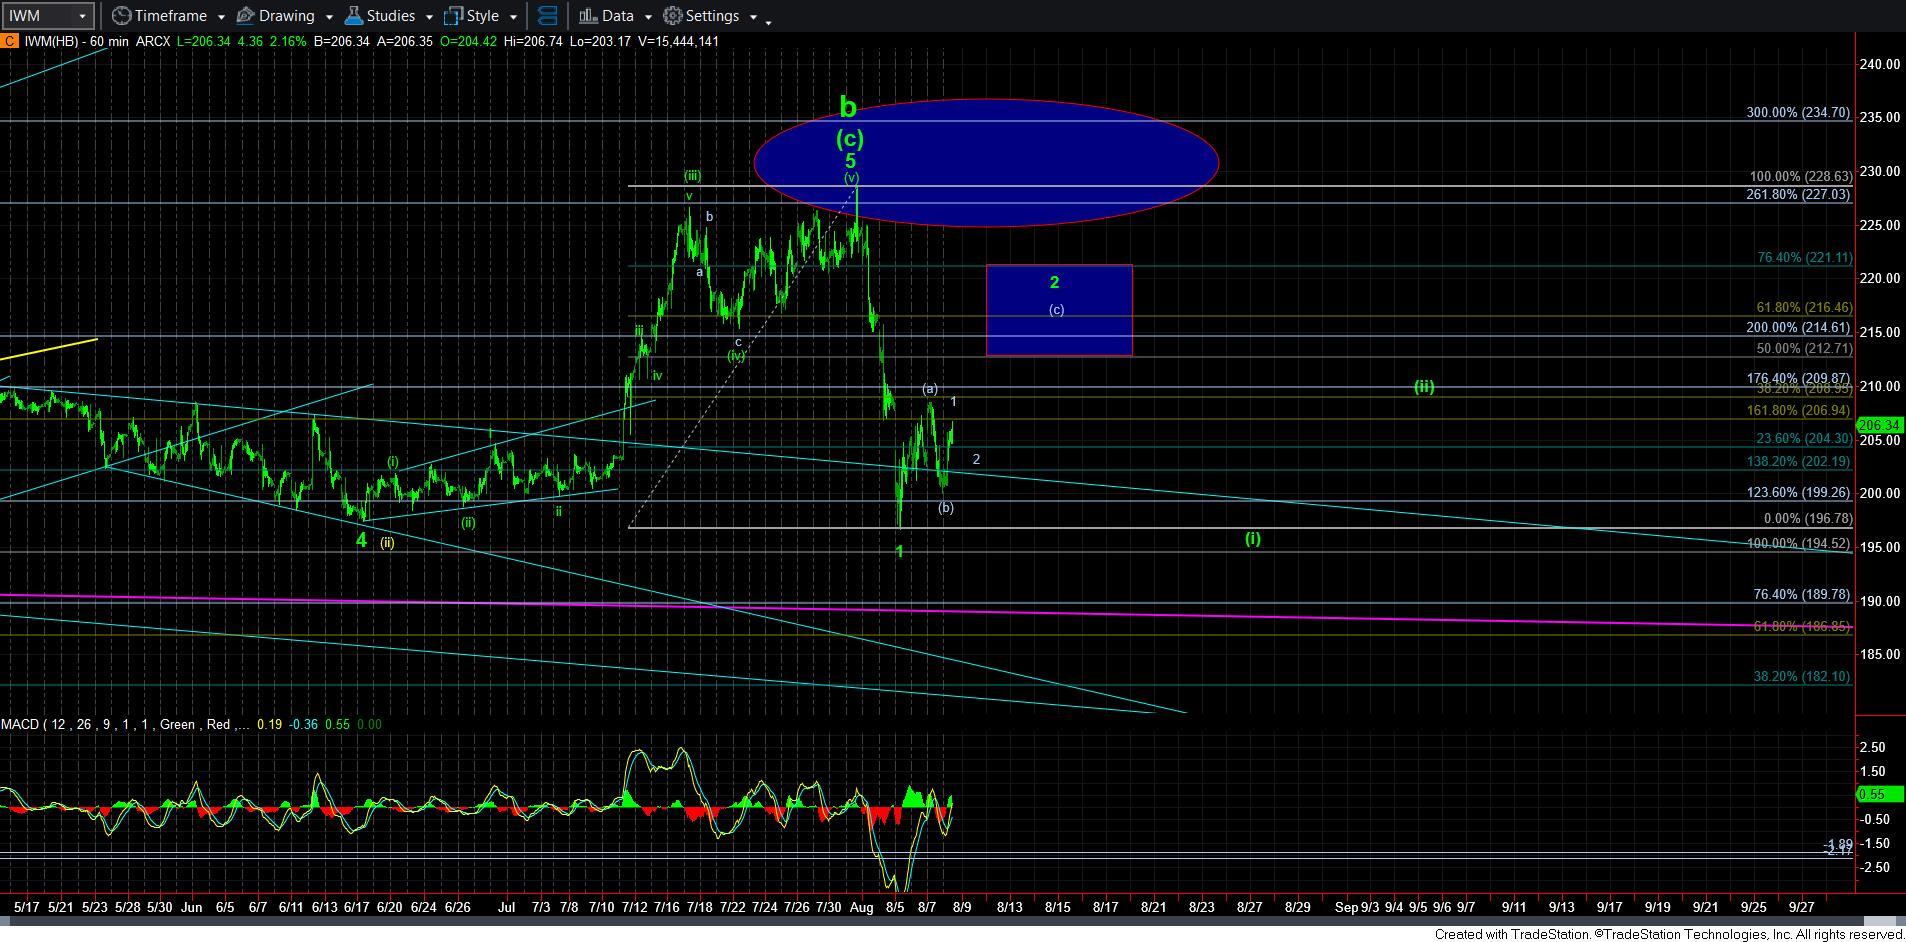
I am also including the IWM and NQ charts to show you how they both align with this expectation. Moreover, I would also say that the SPX chart also aligns with this expectation.
But, I do have to point out that if we continue directly higher towards the 5400ES region in the futures chart, we could consider this [c] wave as completed, which means the b-wave may be completed. While my preference is to first see a wave 2 pullback before we get to 5400ES and potentially higher, I at least have to keep my eye on this potential.
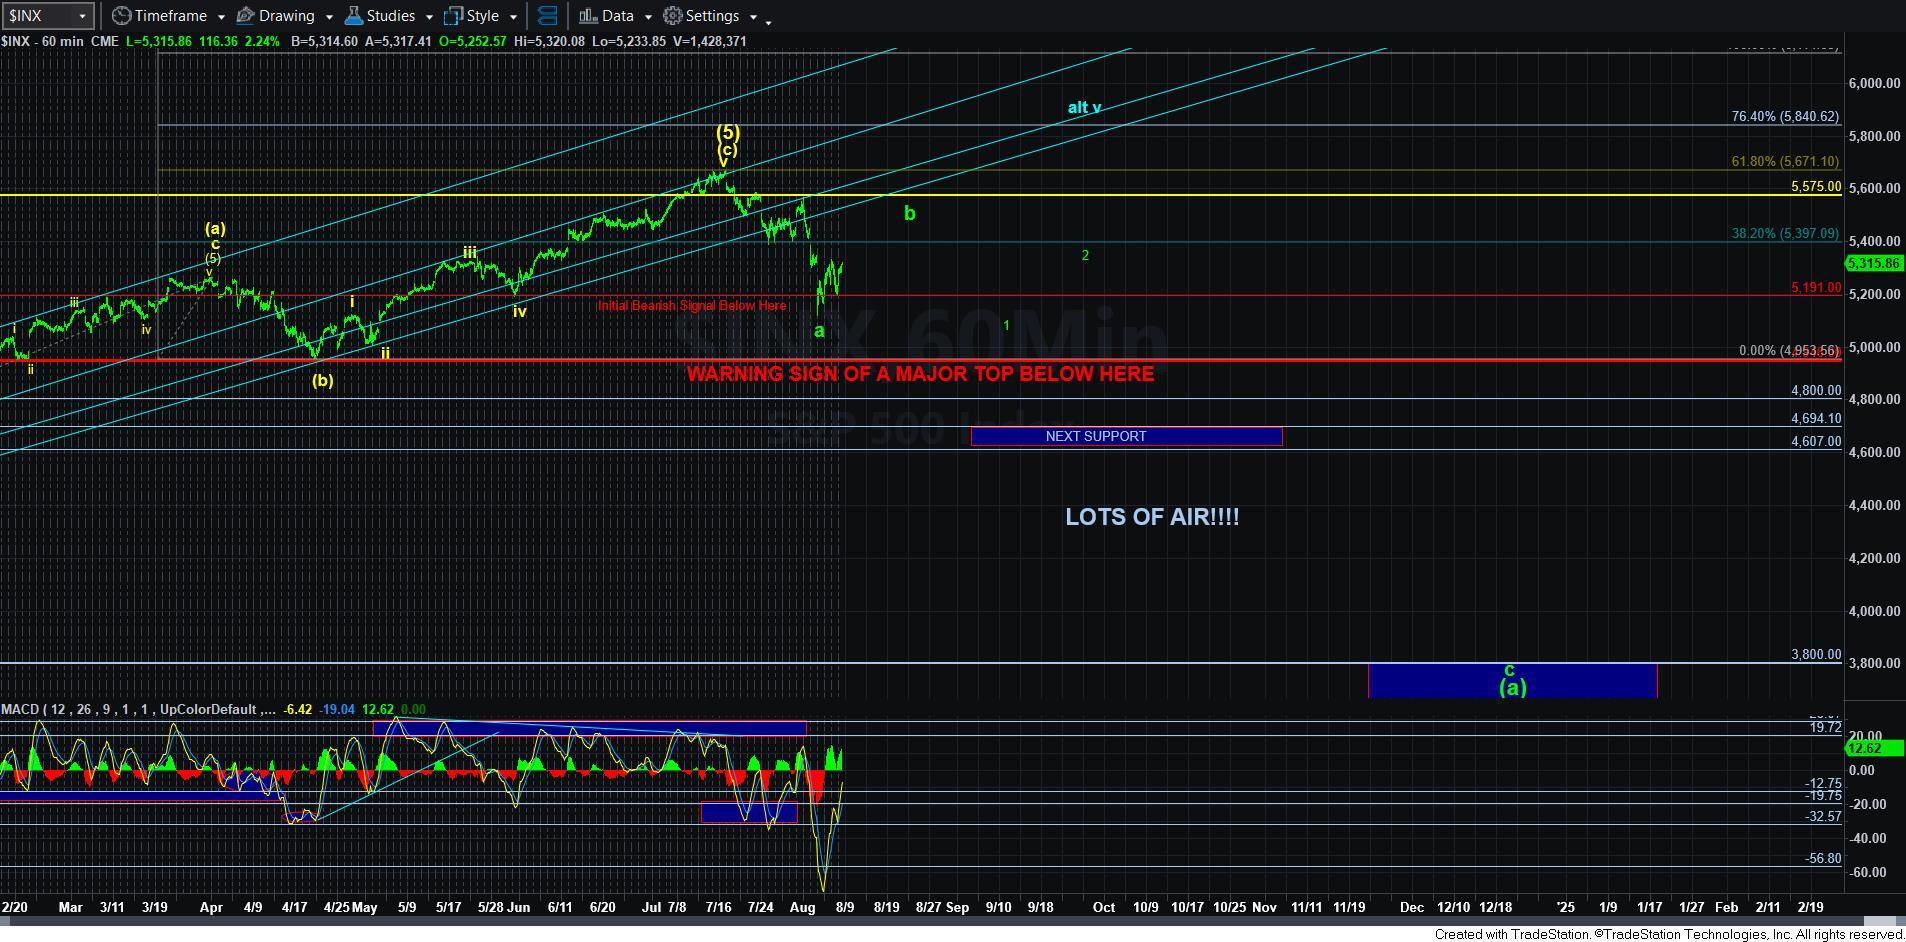
Keep in mind that once this [a][b][c] structure does complete, the drop thereafter will be VERY instructive as to how we are going to trade for the next few weeks if not months. You see, if the market drops in a CLEAR 5-wave decline once this rally completes, then we have to prepare for a crash-like decline that can point the SPX down towards the 3800SPX region and the IWM down to the 130-150 region.
So, clearly, we are going to have to tread very carefully in the coming weeks until the market makes it clear that this set up will not be following through, and the market has the intention of heading higher to the alt v in blue noted on my 60-minute SPX chart.

