Major Inflection Point - Market Analysis for May 9th, 2018
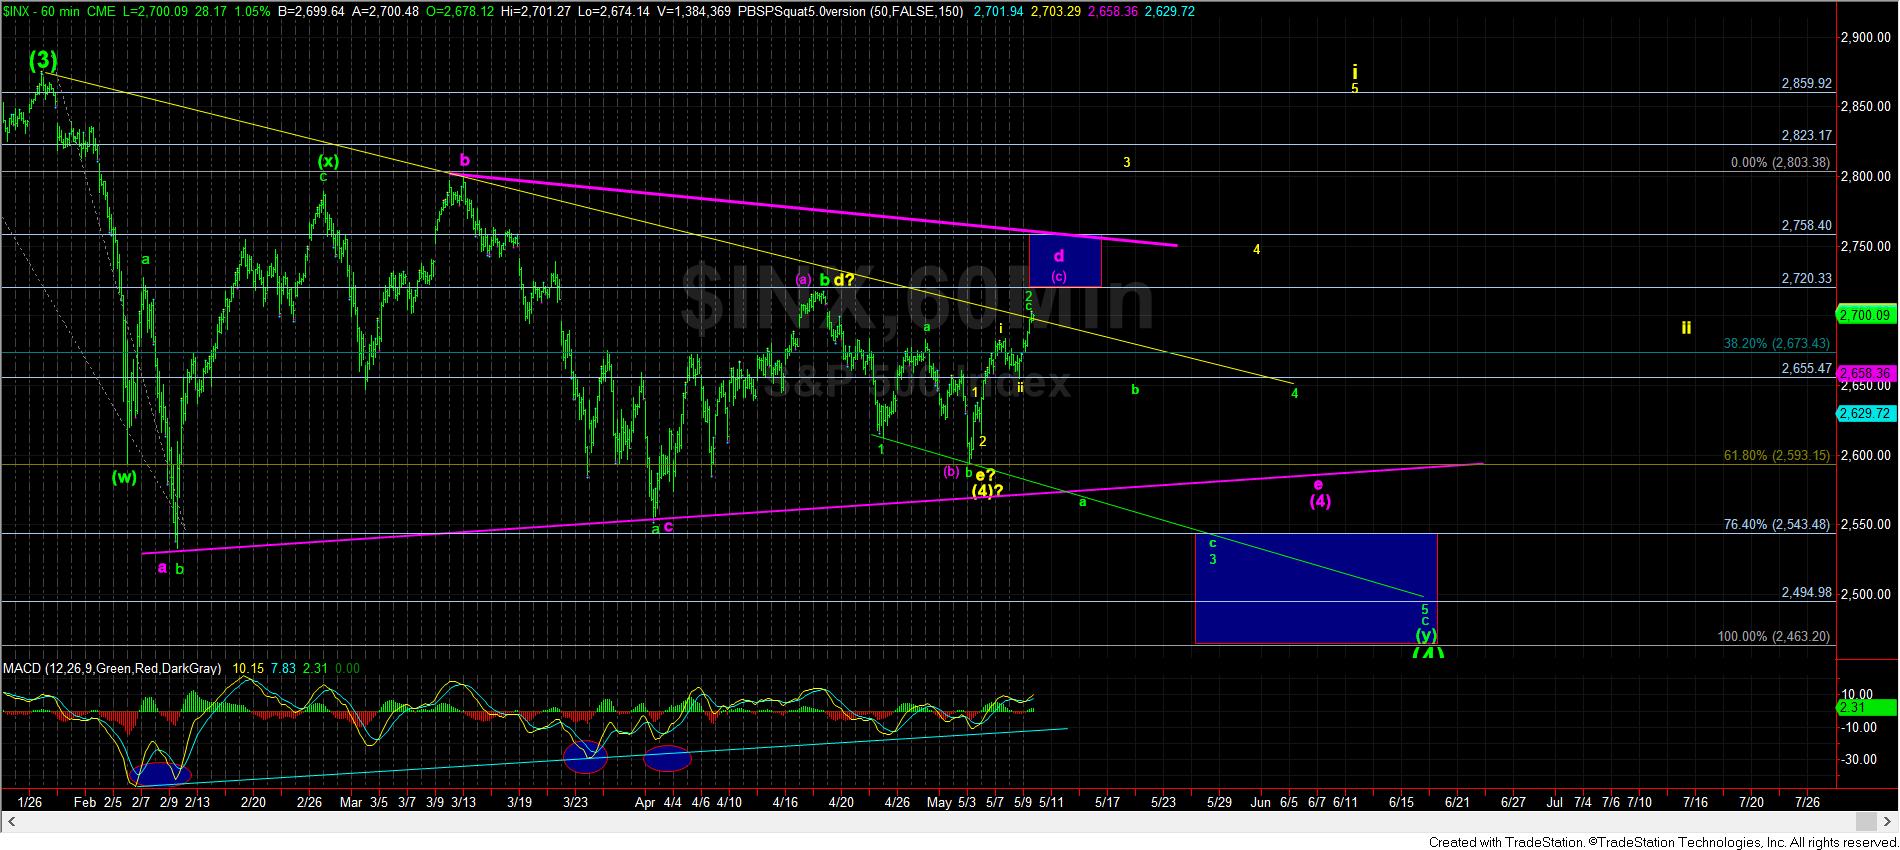
With the market continuing higher as we expected today, we have now come to the initial resistance target for wave 2 in the ending diagonal pattern. And, as long as we do not exceed the 2700SPX by too much, I would expect a turn down from this region.
But, in order to confirm that the market is dropping into the ending diagonal pattern from here, we will need to break below 2655SPX to confirm that we are in the a-wave of the wave 3 of the ending diagonal in green.
Alternatively, if the market is able to move up towards the 2720 region, or a bit higher, then we will have major resistance for the market between 2720-2758SPX, which would still represent the target for the d-wave of the triangle. Again, this is the alternative at this time, and will only be adopted if we strike 2720 or higher.
Lastly, as I noted over the weekend, we MAY have to track the yellow count, which shows the bottom to wave (4) as having been struck. The only way I will adopt that potential is if the market is able to exceed the 2759SPX level, as shown in the yellow count, which would be pointing to the 2800SPX region for wave 3 off the wave (4) in yellow. Right now, I would have to classify this as the lowest probability potential, especially as long as we remain below 2759SPX.
Moreover, even in the event of the yellow count playing out, it still suggests that the market will be coming back to the region wherein we now reside for a wave ii pullback. So, even in the most bullish scenario I am seeing on the chart right now, it does not look like the market will be running hard in a 3rd wave of wave (5) until the fall. Again, this is not my primary focus at this point in time, since we are still below 2759SPX.
In conclusion, while we do not know what the market will do with certainty, we have two high probability turning points for the market. The first is right here in the 2700-2710SPX region, which would still keep us in the ending diagonal pattern, pointing down to the 2495SPX region. The next higher region is 2720-2758SPX. That would be a d-wave in a larger degree wave (4) triangle. However, if both resistances are exceeded, then we may have to consider wave (4) can be complete, as presented in yellow. For now, I remain in the green count until proven otherwise.
But, remember, we need to see a break below 2655SPX to begin to confirm that the a-wave of wave 3 is in progress. So, you may not want to be aggressively shorting until we break support. It is still a larger degree bull market, which is still likely heading over 3000.