Major Inflection Point - Market Analysis for Sep 29th, 2015
With the triangle potential I posted over the weekend clearly broken, the market is at a major decision point right now. Over the weekend, the general guidelines I presented were as follows:
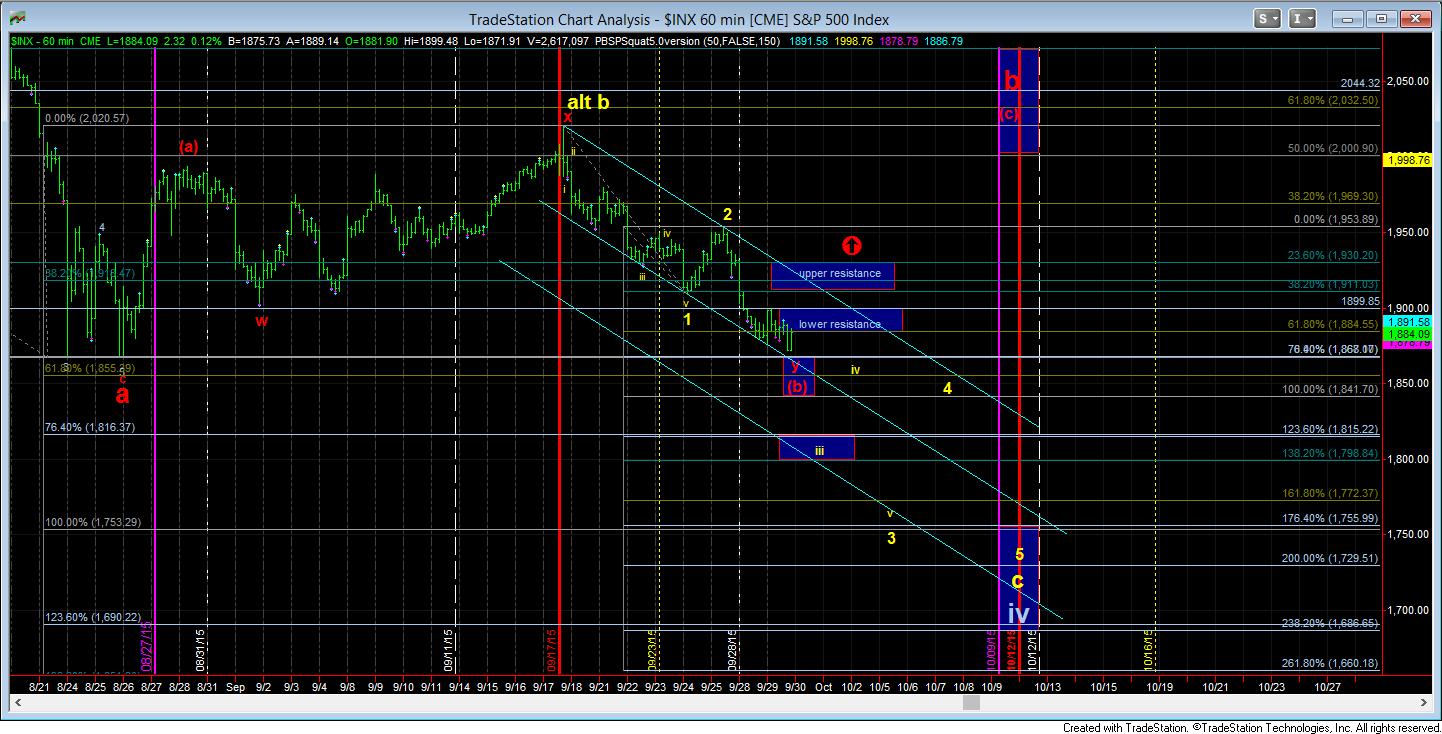
“a break down below 1885SPX points us towards the August lows, which, if broken, has me minimally targeting the 1820-1835SPX region, with an ideal target in the 1775SPX region and extension target at 1694SPX.”
The breakdown below 1885 has clearly placed the market in a precarious position. But, we still need that break down below the August lows to begin confirmation of heading down to what seems to be a target between 1690-1750.
As far as the yellow count on the chart, the main reason I have not used the immediate break down pattern as my primary count is because the only way I can really get a good impulsive count down is counting wave 1 down as a non-overlapping leading diagonal. These are not at all common patterns, which is why I had to consider it as a lower probability. And, until we actually get the break down below 1867, without breaking back over 1885SPX at any point in time, I still question whether the yellow count will play out.
In order for it to prove to me it wants to drop sooner rather than later, tomorrow will likely present as a key follow through day. In fact, if the market is really going to prove itself to be heading down sooner rather than later, tomorrow pay present a day of extreme carnage and can begin a drop of 40+ points for the continuation of wave iii of 3.
So, this is how I am going to view the difference between the two counts – but please read this carefully as you follow along with the chart, as it can be a bit complex. As the market unfolds tomorrow, I will clearly be updating everyone on my thoughts in the Trading Room.
As long as the market remains below the 1900SPX tomorrow, the pressure will remain down. Should we maintain resistance, and see a sustained break down below 1867SPX, the next lower support is 1841SPX. However, if the market is truly in as bearish a posture as the yellow count suggests, we should break the 1841SPX level, and head down to the yellow iii box very quickly. However, if 1841SPX does hold as support, it does open the door to an expanded (b) wave potential, which is ONLY CONFIRMED if we break back over 1885SPX. But, once we see a strong break down below 1867SPX, the lower resistance noted on this chart becomes the PRIMARY RESISTANCE.
So, in conclusion, the 1885-1900SPX zone must be maintained as resistance if the market is heading down in the yellow impulsive count in the very near term. A break down below 1867SPX, which maintains below 1885SPX on ALL bounces maintains our pressure to our target of 1690-1750SPX.
However, if the market is able to move strongly through 1900SPX in an impulsive fashion, and then take out the upper resistance region, it has me targeting at least the 2000 level one more time, with the potential to rally as high as 2072SPX, depending upon how the rally takes shape.
The next 48 hours should tell the story.