Lower Lows Struck Early In The Week
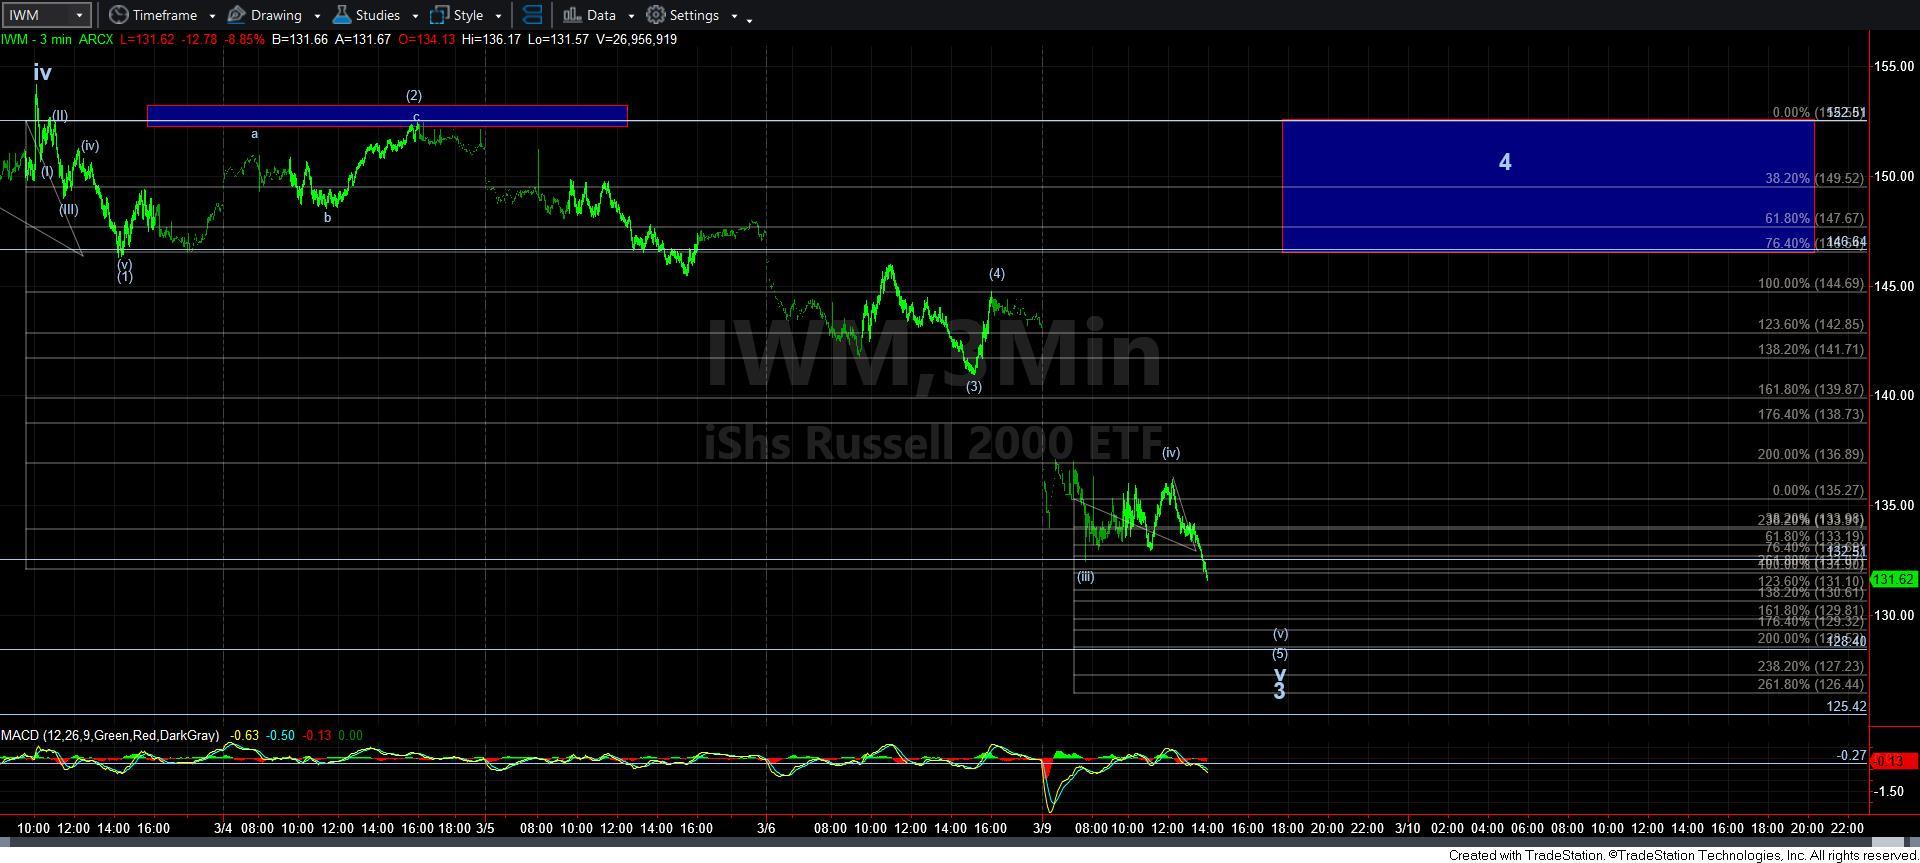
As we have been following the IWM structure for clues as to how the equity market will likely play out in the coming months, we closed the market on Friday with an expectation that we should see one more bout of weakness before wave v of 3 completes in the IWM:
“On Friday afternoon, the market bottomed between the 1.382-1.618 extension of that wave [1][2] downside set up, and began a bounce into the end of the day on Friday. Since I am tracking this as a wave v of 3 of the larger degree structure, it means I really need to see it complete 5 waves down for wave v. So, as you can see on the attached 3-minute IWM chart, I am still expecting one more bout of weakness early in the coming week to complete wave [5] of v of 3 of the c-wave down in the IWM.”
But, what did not follow through on my expectation is that the SPX clearly has made a lower low along with the IWM. So, when the market does not track exactly according to my expectations, it makes me consider what the SPX may be doing that made it a bit different than my expectations from last week.
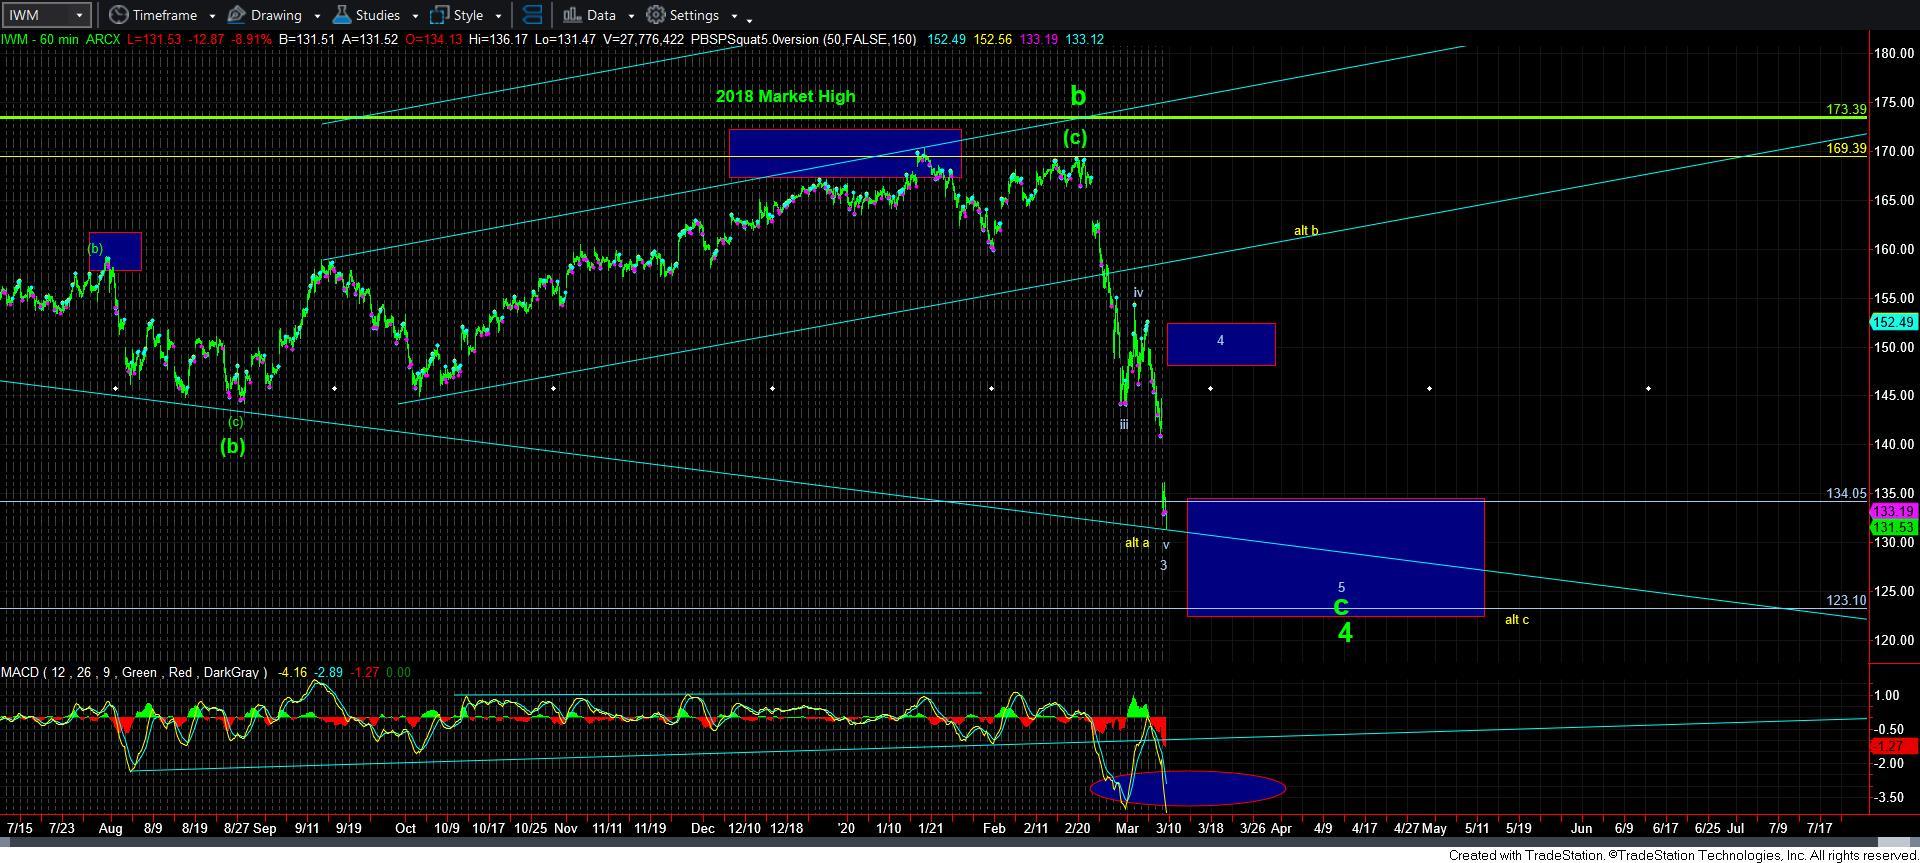
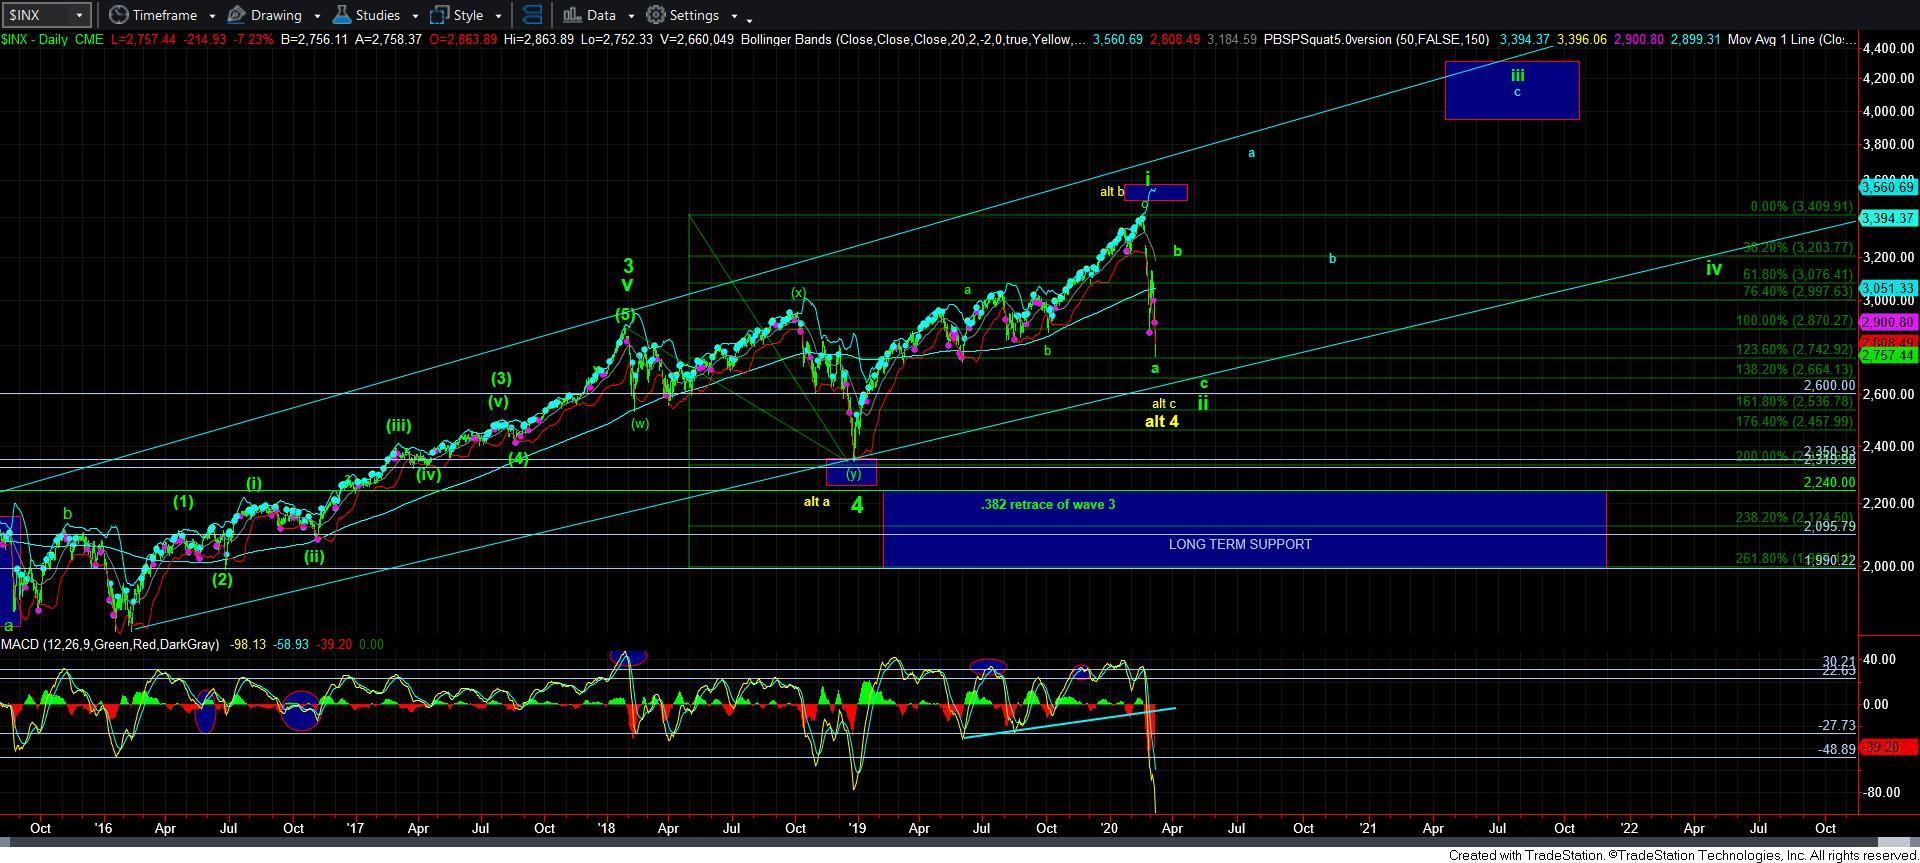
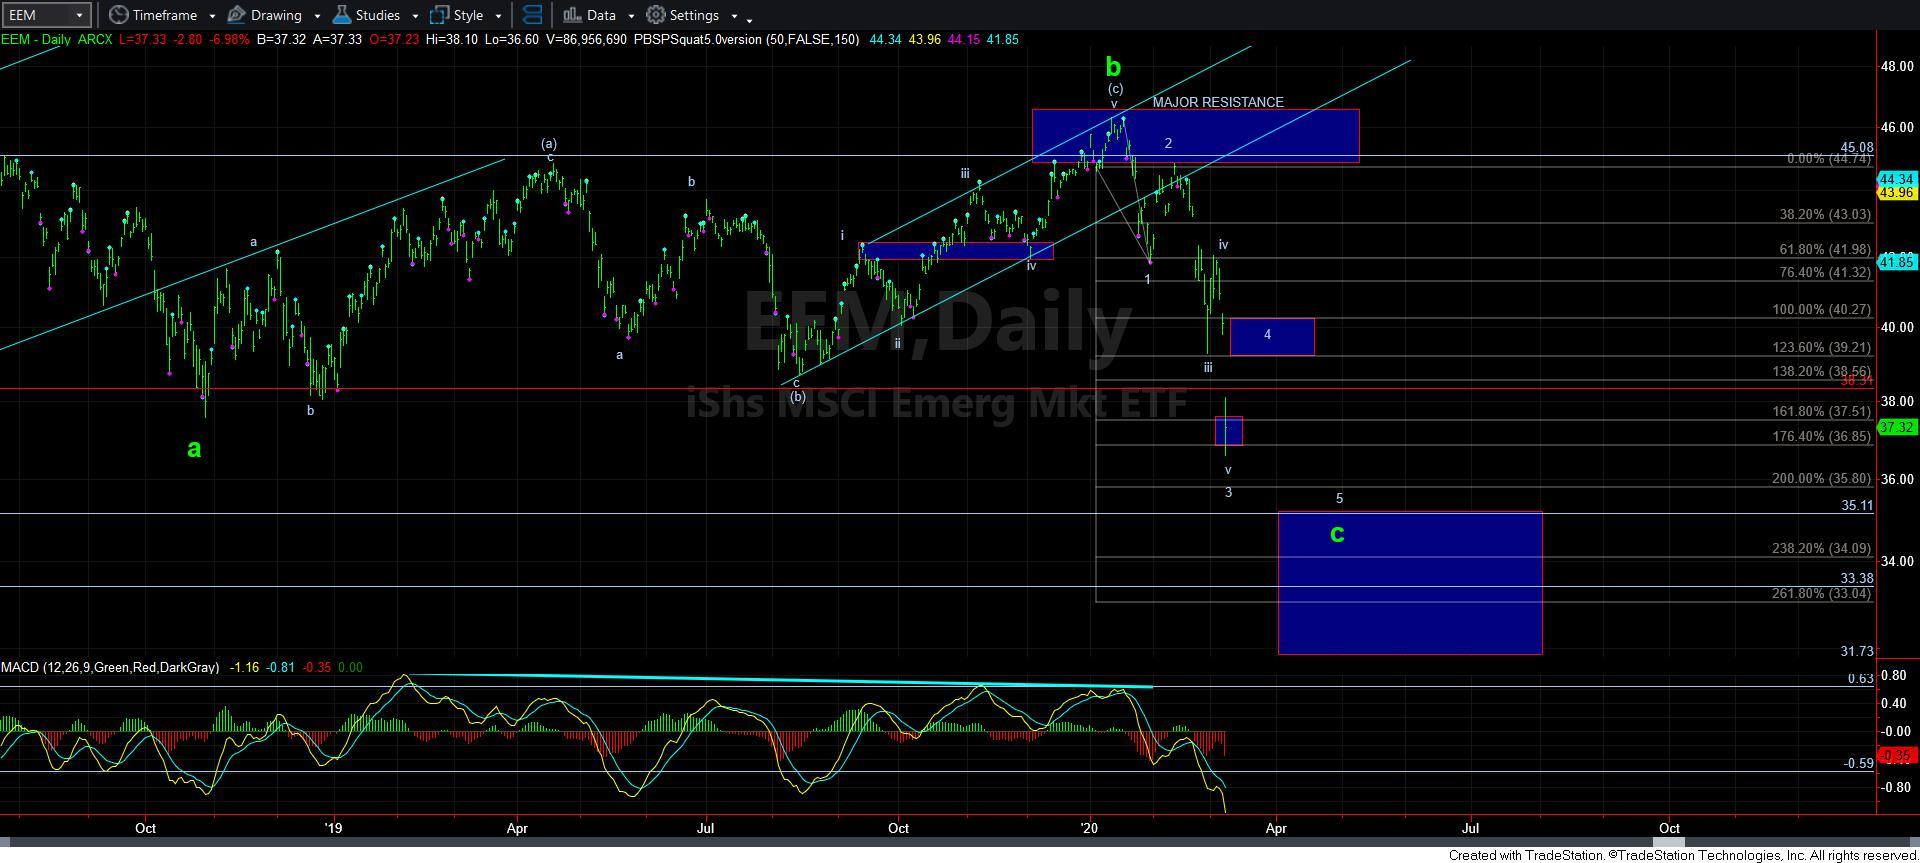
Since the SPX is following through step by step with the IWM, it has caused me to adjust the yellow count as shown on the 60-minute chart. What this means is that if the SPX only sees a shallow retracement on the next “bounce” in the market that I am expecting this week, then I am going to more strongly consider all the action from 2018 until today as a running flat for the 4th wave in the SPX. In fact, this would then align the count in the SPX with the IWM and the EEM.
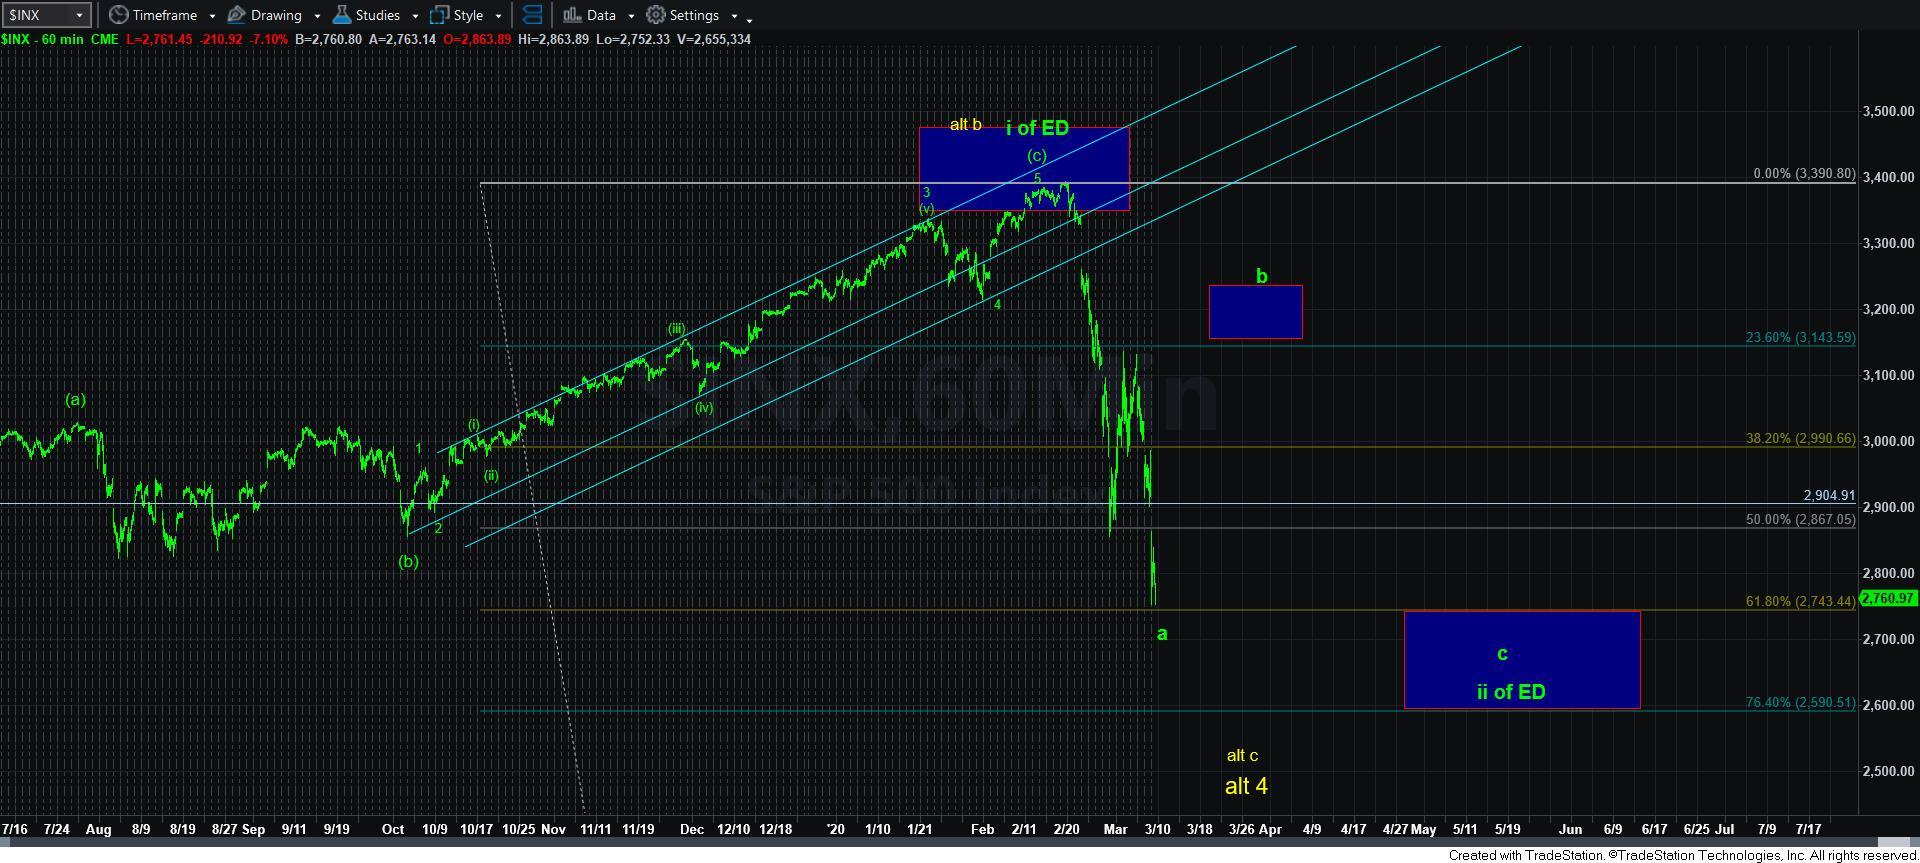
For now, my primary expectation remains that we are still completing the a-wave of the a-b-c wave ii structure. And, if this is the correct wave structure, then the next rally will still take us back up towards the 3150-3300 region for a b-wave, as shown on the 60-minute chart. However, if the IWM and the SPX only see shallow retracements, whereas they could be better counted as 4th wave rallies, then I will likely move into the yellow count for the SPX, and view the SPX in alignment with the IWM and the EEM.
But, for now, I am still going to be tracking the IWM to analyze the market action. Doing so has provided us highly accurate expectations of late, and I don’t expect that to change. So, as long as we begin to bottom out in wave 3 over the next day or so in the IWM, I am going to expect a wave 4 bounce to take us back towards the 146-152 region. However, we will need to move through the 137 region to suggest that wave 3 has likely completed.
With regard to the SPX, if the SPX outperforms the IWM on the next rally, and provides for us an adequate b-wave rally towards the box on the 60-minute chart, then I will maintain the i-ii wave structure as my primary analysis perspective. However, if the SPX is unable to see more than what would normally be a 4th wave bounce, then I will likely move into the yellow count, wherein the SPX would align with the IWM and the EEM, wherein all 3 would still need to complete a full 5-wave rally before a major top is struck within the next few years.
The last point I want to make is that I just don’t how the SPX would project down to the 2200-2350 region even in the yellow count. As it stands now, it would still seem likely that the SPX would hold the 2600 region even in the running flat count. The only question is if we drop directly towards that region (potential yellow count) or if we see a bigger b-wave bounce, which would support the i-ii set up in green. Clearly, I am not going to be able to confirm either scenario until we see how the next bounce takes shape, which I would like to see begin quite shortly.