Lower Likely To Be Seen
When the market was near the all-time highs recently, the masses were getting all bulled up again. While I was not certain if the market could squeeze out a higher high or not, I had reiterated many times that the market was in a very “treacherous” posture for most of last week. Those that heeded our warnings were not caught in this downdraft, especially since we were expecting another decline to begin in the near term.
While most market participants had been hailing the bullish perspectives as we headed higher in September, we remained quite staunchly in opposition to those believing the market was going to break out in a meaningful way just yet. And, believe me, it is not easy standing against the tide of common expectations. While we will not always be correct in our assessments, we will always remain true to our analysis, and have been proven out to be correct greater than 70% of the time based upon our own subscribers’ tracking.
But, I digress.
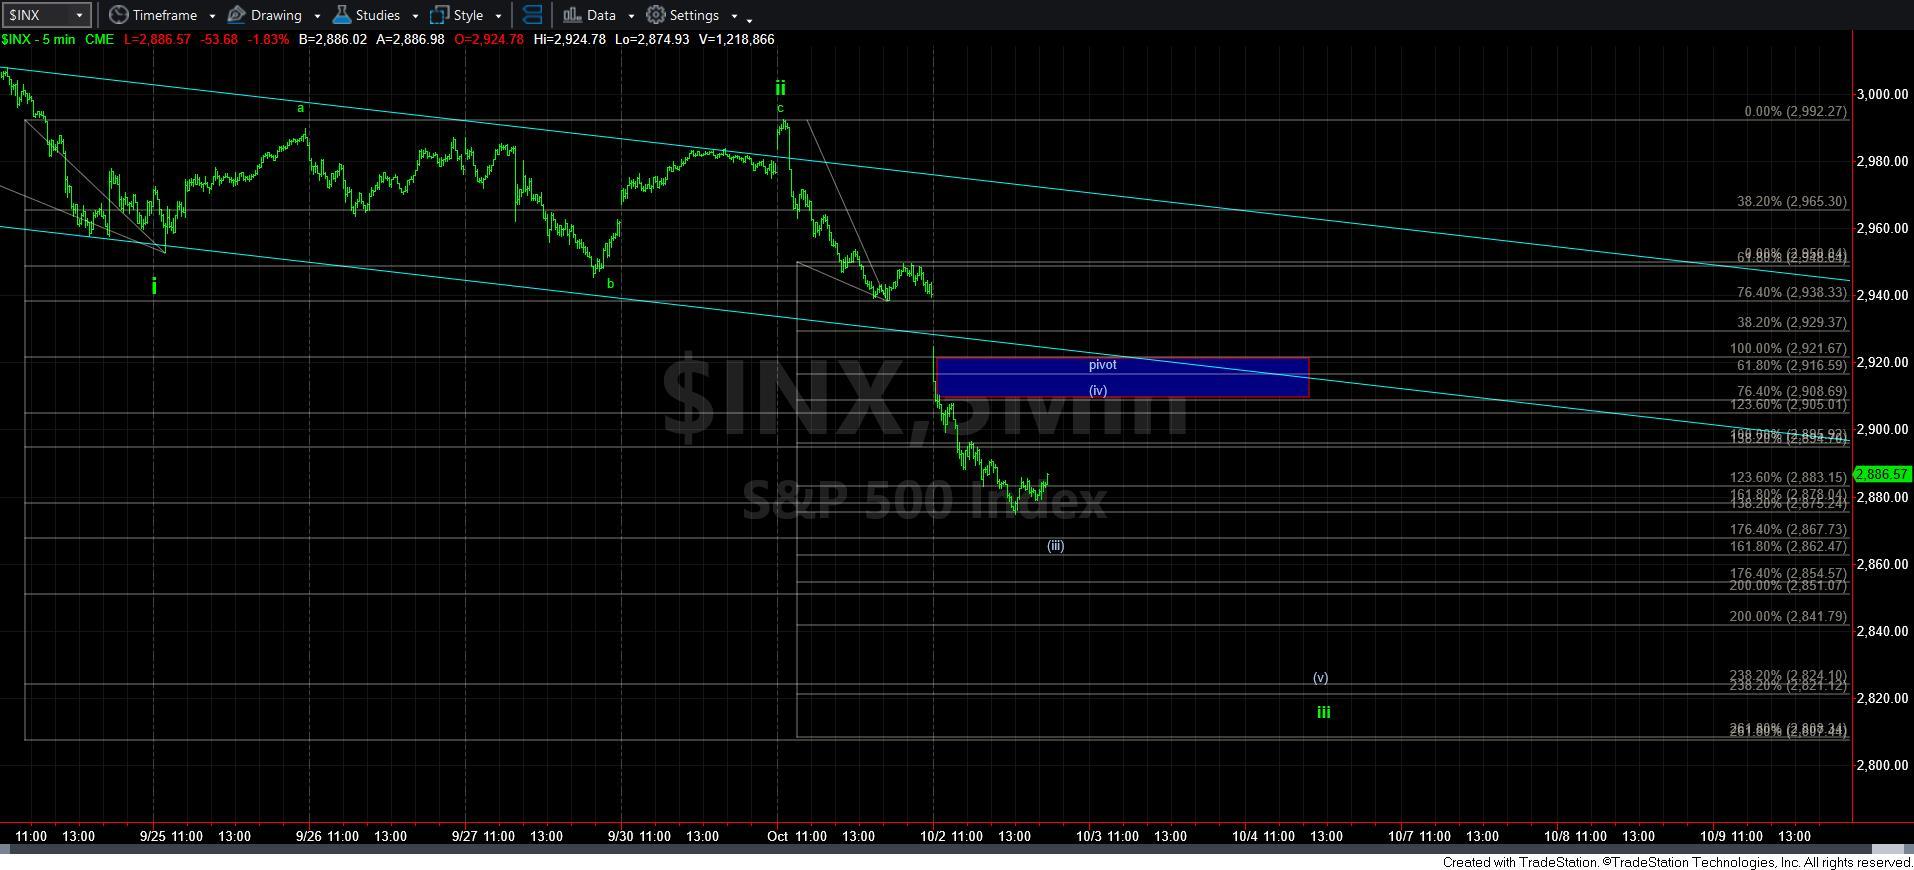
The structure off the highs presented us with a very overlapping pattern. But, once the market broke the support pivots, it made it rather clear that we were in the process of dropping down in the c-wave we have been expecting.
At this time, I am counting us as either having one more decline to complete wave (iii) or iii, or we have already completed wave (iii) of iii, and have begun wave (iv) of iii. Due to us needing larger extensions to get to our ideal target below, I am not yet sure how far (iii) of iii will extend.
As far as downside targets, I outlined my perspective earlier this morning in the chat room and in an alert:
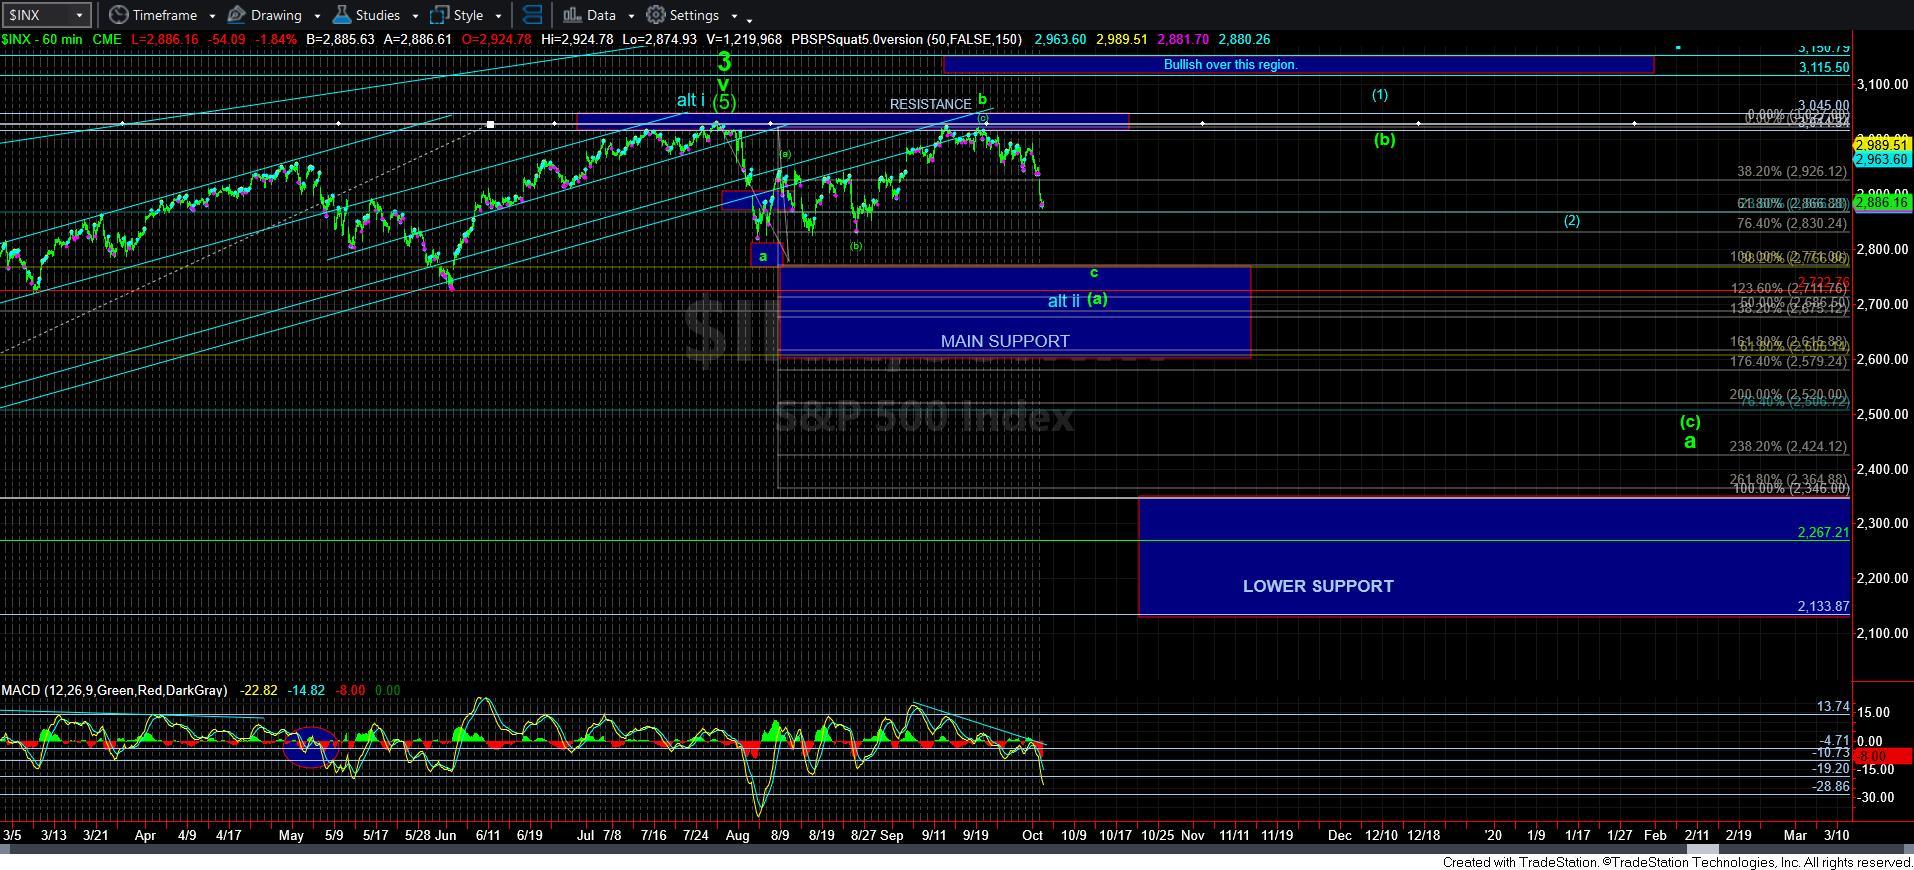
“With the a and b waves in place, the a=c target for this decline is the 2771SPX region. But, I want to highlight that this is assuming the bottom of the a-wave at 2777, which is where it struck in the futures. Moreover, you can see that this would tag the exact top of our support box.
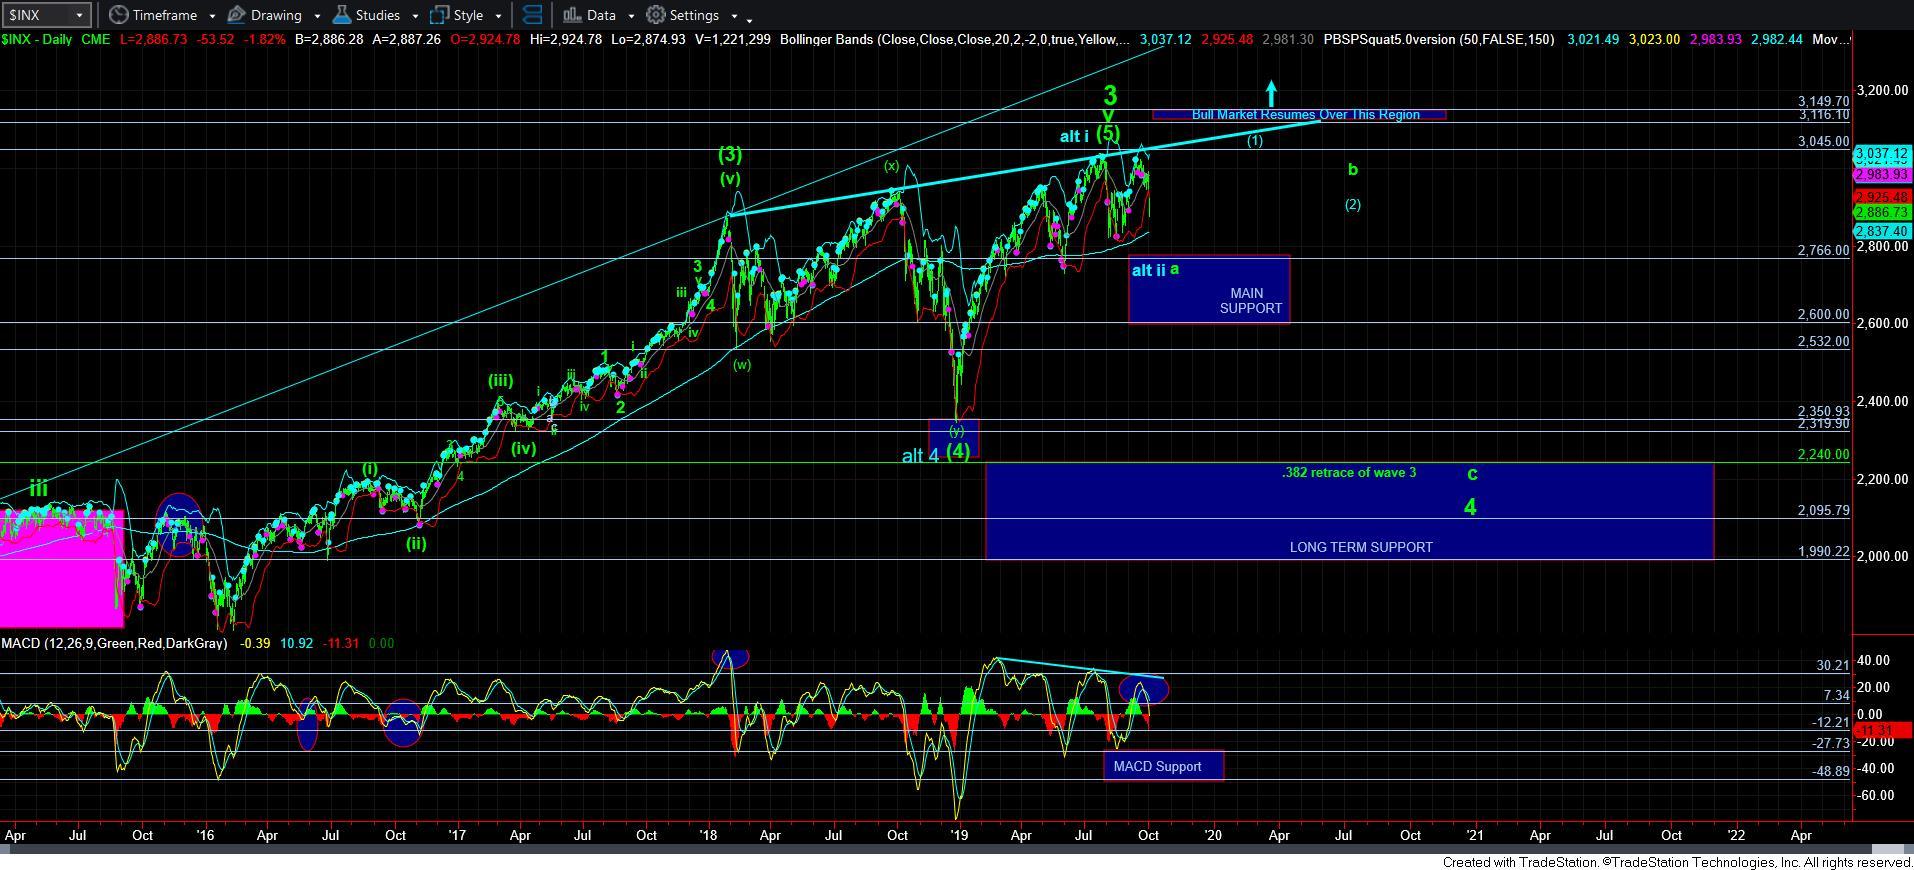
So, if we see a 5-wave decline take us into that target region, then I would view that as a set up for a long trade. My expectation at this time is that it will be a b-wave rally that can last us into the end of the year. And, the alternative is that it will be the start to wave iii of the final 5th wave to 3800-4100. I do not have to make a decision about what it actually is until we see how it rallies. If it rallies correctively, then we can be more confident in the primary count. If it rallies impulsively, we will be long at that point anyway.
Lastly, since I think we could see strong extensions take us down to that 2771 region, I want to allow a 5-wave structure to complete - which means seeing a discernible 4th wave bounce - before I would consider this as bottoming. There is still a lot of room below us on the daily MACD until it moves back to support, so nothing says that extensions cannot take us deeper into the support box.”
While taking all of this information into account, I want to add a few further pieces of information. The wave (iii) of iii is often the technically strongest segment within a 5-wave structure. However, the wave (v) of iii is often the longest segment within that wave iii. Moreover, since the 2771SPX region is an ideal target, we will need to see some larger extensions taking us closer to that region within wave iii. So, my expectation is that wave (v) of iii will likely take us down towards the 2800SPX region to complete all of wave iii of c.
In summary, as long as the market respects the pivot between 2905-22SPX, I am expecting us to target the 2771SPX region in the coming week or two.