Looks Like Corrective Action – But Stay On Your Toes
When we closed yesterday, the market had no imminent upside set up in place, nor did it seem to have a downside structure completed either. But, the imminent upside set up became evident early this morning, as it developed overnight.
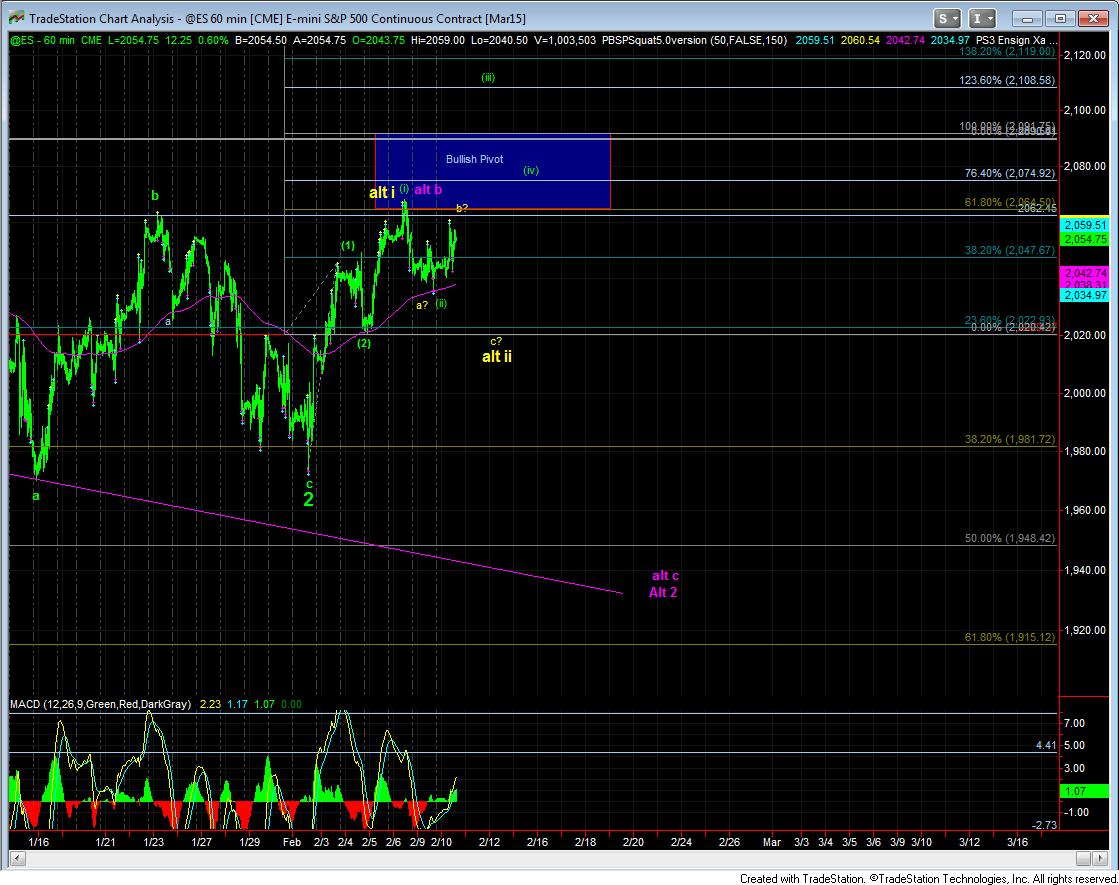
To further complicate this current region within which we now find ourselves, most of the movement we have seen to the upside today has developed with several 3 wave structures. To me, that seems to keep the door open for another drop to be seen within the next day or two.
But, I also want to take a moment to explain why I have the green (i)(ii) still on the chart. The market is in a position where it can explode up in the heart of a 3rd wave. I want to impress upon people that whether or not we are able to identify the accurate micro count which provides us with a high degree of certainty that it will begin tomorrow – as sometimes we cannot, the potential clearly exists in this set up, even though I think it is more likely that we see another downside loop based upon the micro wave structure. And, should the market simply gap up and run over last week’s high, that would be my signal that wave (iii) of (3) of 3 is upon us, which should take us to 2108ES within a matter of a few days.
However, if we are following the correct micro-structure, we can still see another drop lower. And, this consolidation has now become too big – should we see another drop – to be wave (ii) in green. Rather, that would move me to the modified yellow alternative now placed on the chart, which is that we completed wave i of 3, not at 2150 and the .618 extension as I had initially wanted to see, but, we completed it at just below the .382 extension, which is also an appropriate target for wave i of 3. Should we see a drop in the next day or so, this will become my primary count.
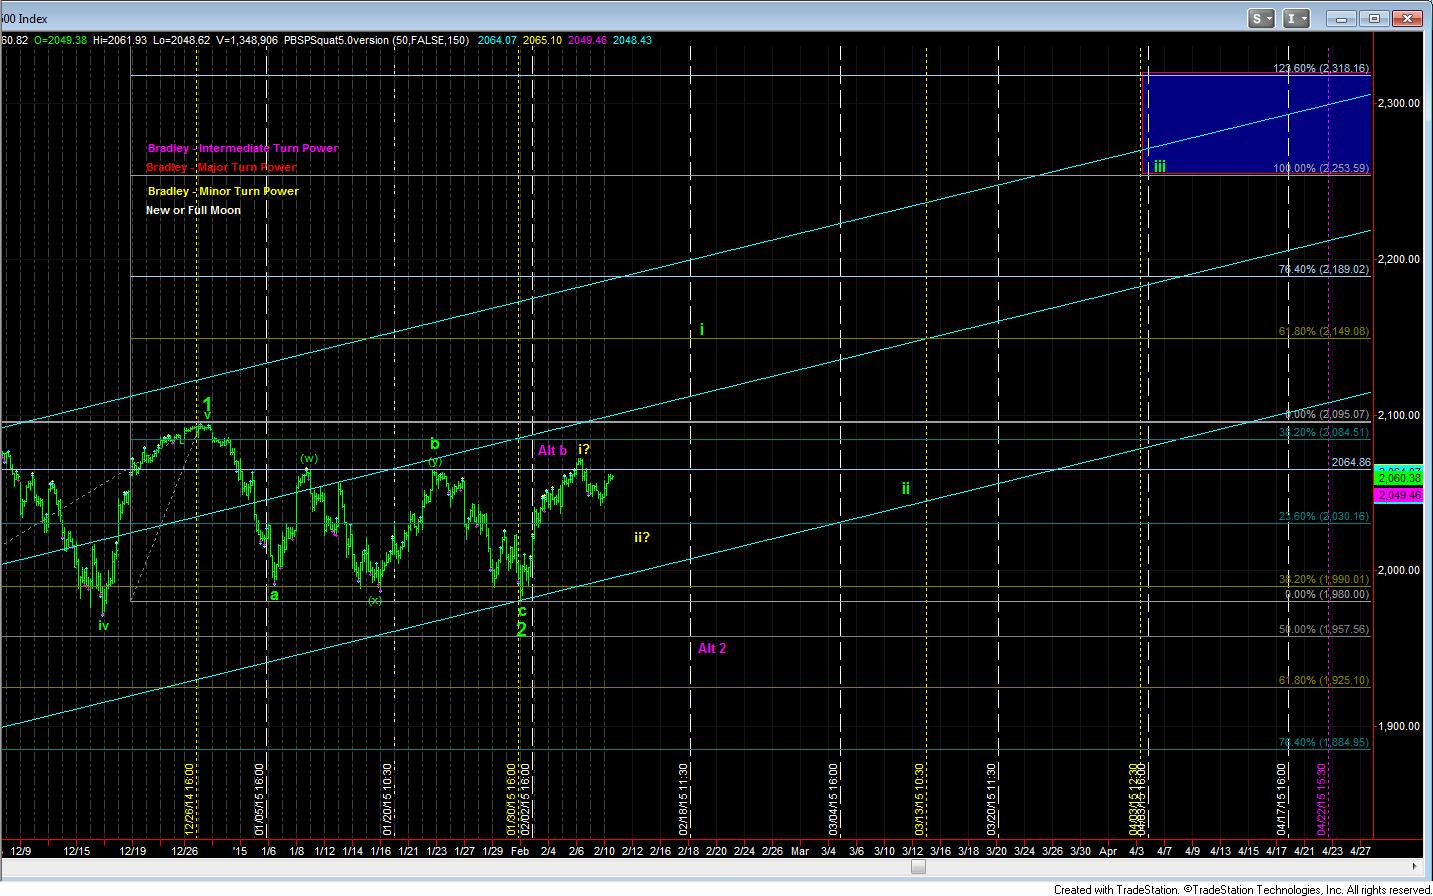
Ultimately, I am still expecting this market to see higher levels. The question with which we are now grappling is the specific micro count which will take us to those higher levels. The yellow count would be taking us to the 2200 region rather quickly, whereas the green count would still see a pullback in wave ii going into March. As the market provides more information in this region, we will better be able to narrow down the potential.