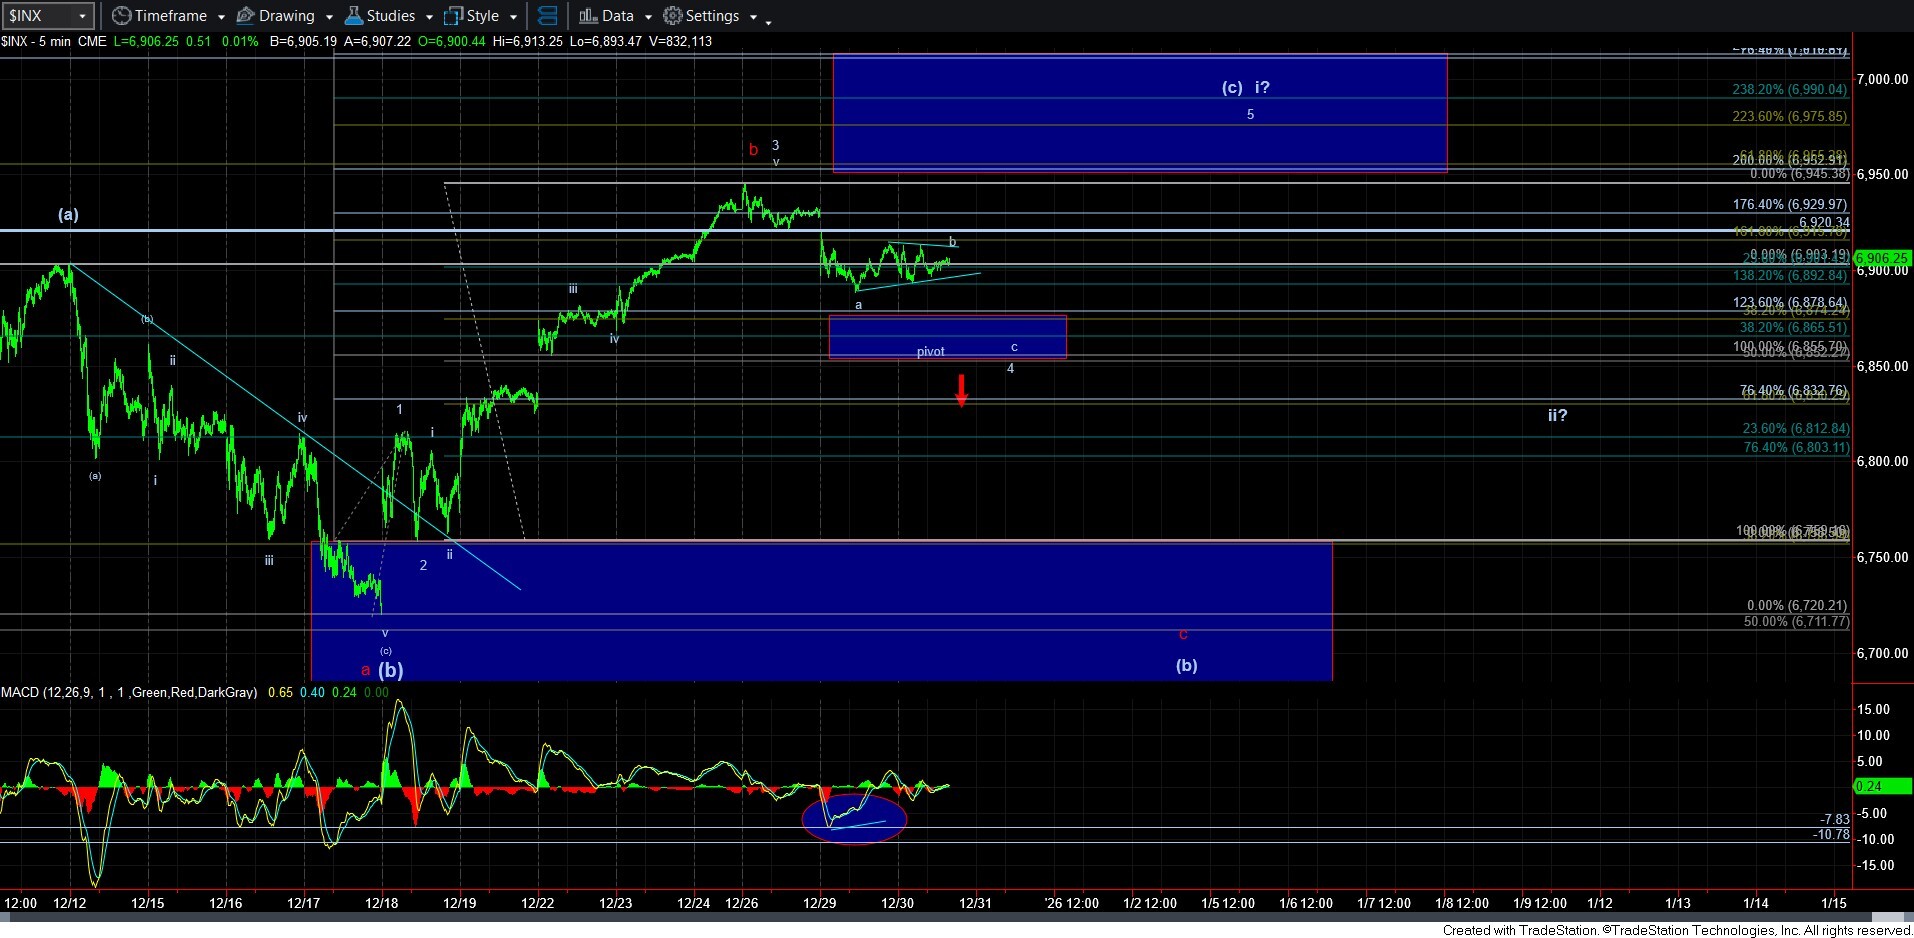
Looks Like A Triangle
With the sideways action today, it does look like the market is trying to trace out a triangle. While we most commonly see triangles in b-wave and 4th wave positions, it seems a bit big to be a 4th wave in the c-wave of wave 4. So, by process of elimination, I think it may be a b-wave triangle, with a c-wave decline to the support likely our next step.
So, to keep this simple, as long a we remain below 6913SPX, then I can look for a c-wave decline, which seems to be pointing towards the lower end of the support box. Should the market break out over 6913SPX first, then it would suggest this triangle is one of those rare y-wave triangles, within a w-x-y 4th wave pullback. And, the break out over 6913SPX would suggest that the 4th wave is done, and the 5th wave has likely begun.
And, again, as long as the pivot holds as support, I am still looking for a 5th wave rally.