Looking Very Bullish - Market Analysis for Nov 10th, 2016
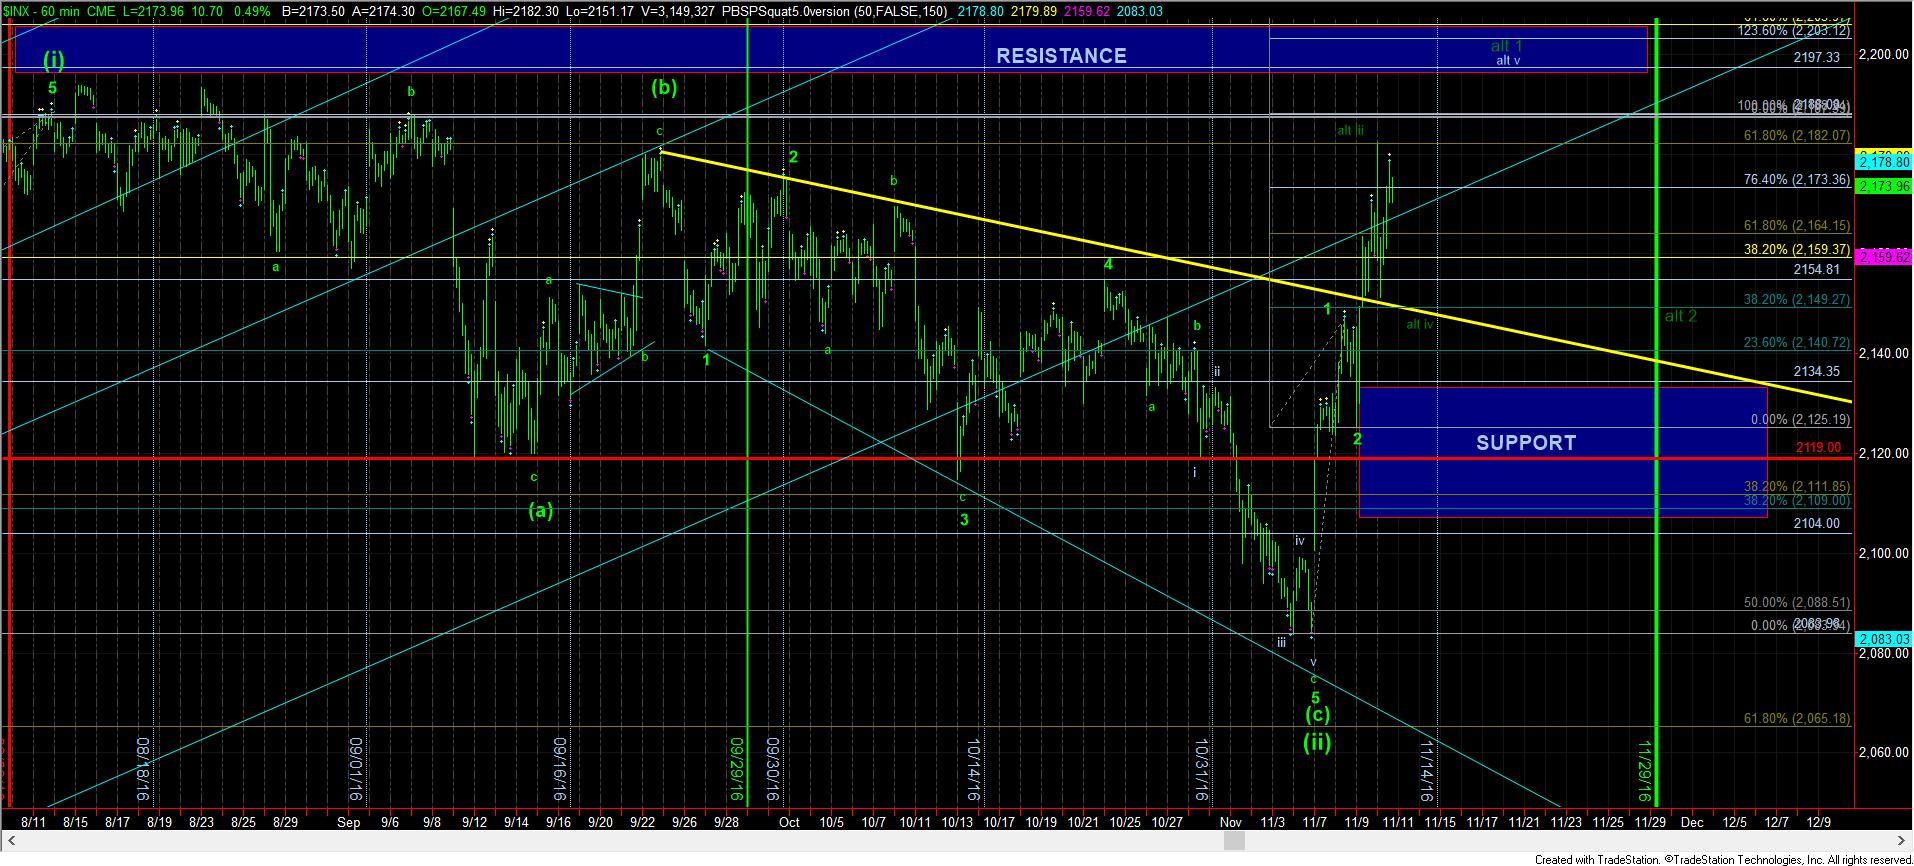
While the market did provide a strong gap up today, it did not specifically adhere to the micro count I presented yesterday. This usually means I am tracking the wrong micro count, which is probably occurring due to the overnight action the other night.
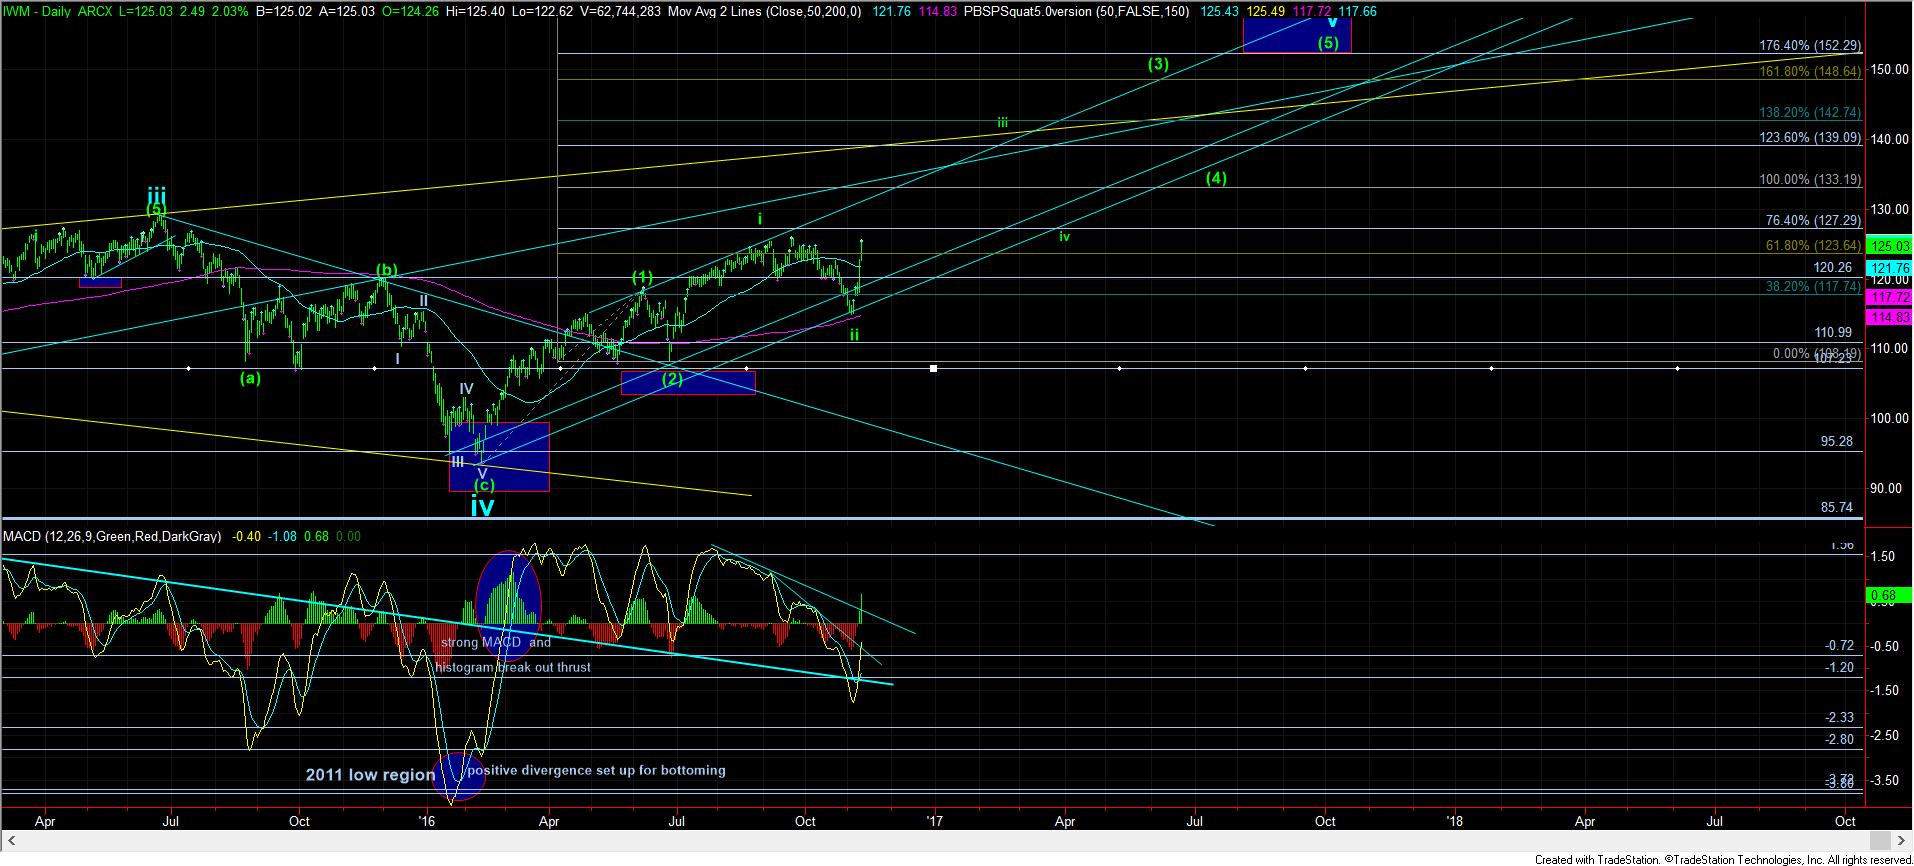
So, I have modified my 60 minute chart for that potential, which would mean today’s pullback was part of a wave iv in a bigger wave 1. Moreover, the IWM pattern strongly argues for this potential as well.
Regarding the IWM, I wanted to post the chart yet again. Since we approached the bottom earlier this year and we were warning that it had tremendous bullish potential, the chart has followed through quote nicely. We were waiting for the market to bottom out in a wave ii of (3), and the market seems to have resoundingly suggest that it has. This is exactly how the heart of a 3rd wave should look.
While it may take a few more days to nail down the micro count in the SPX, the message seems to be the same, and that is that the heart of the 3rd wave seems to have begun.