Looking For Resolution This Week
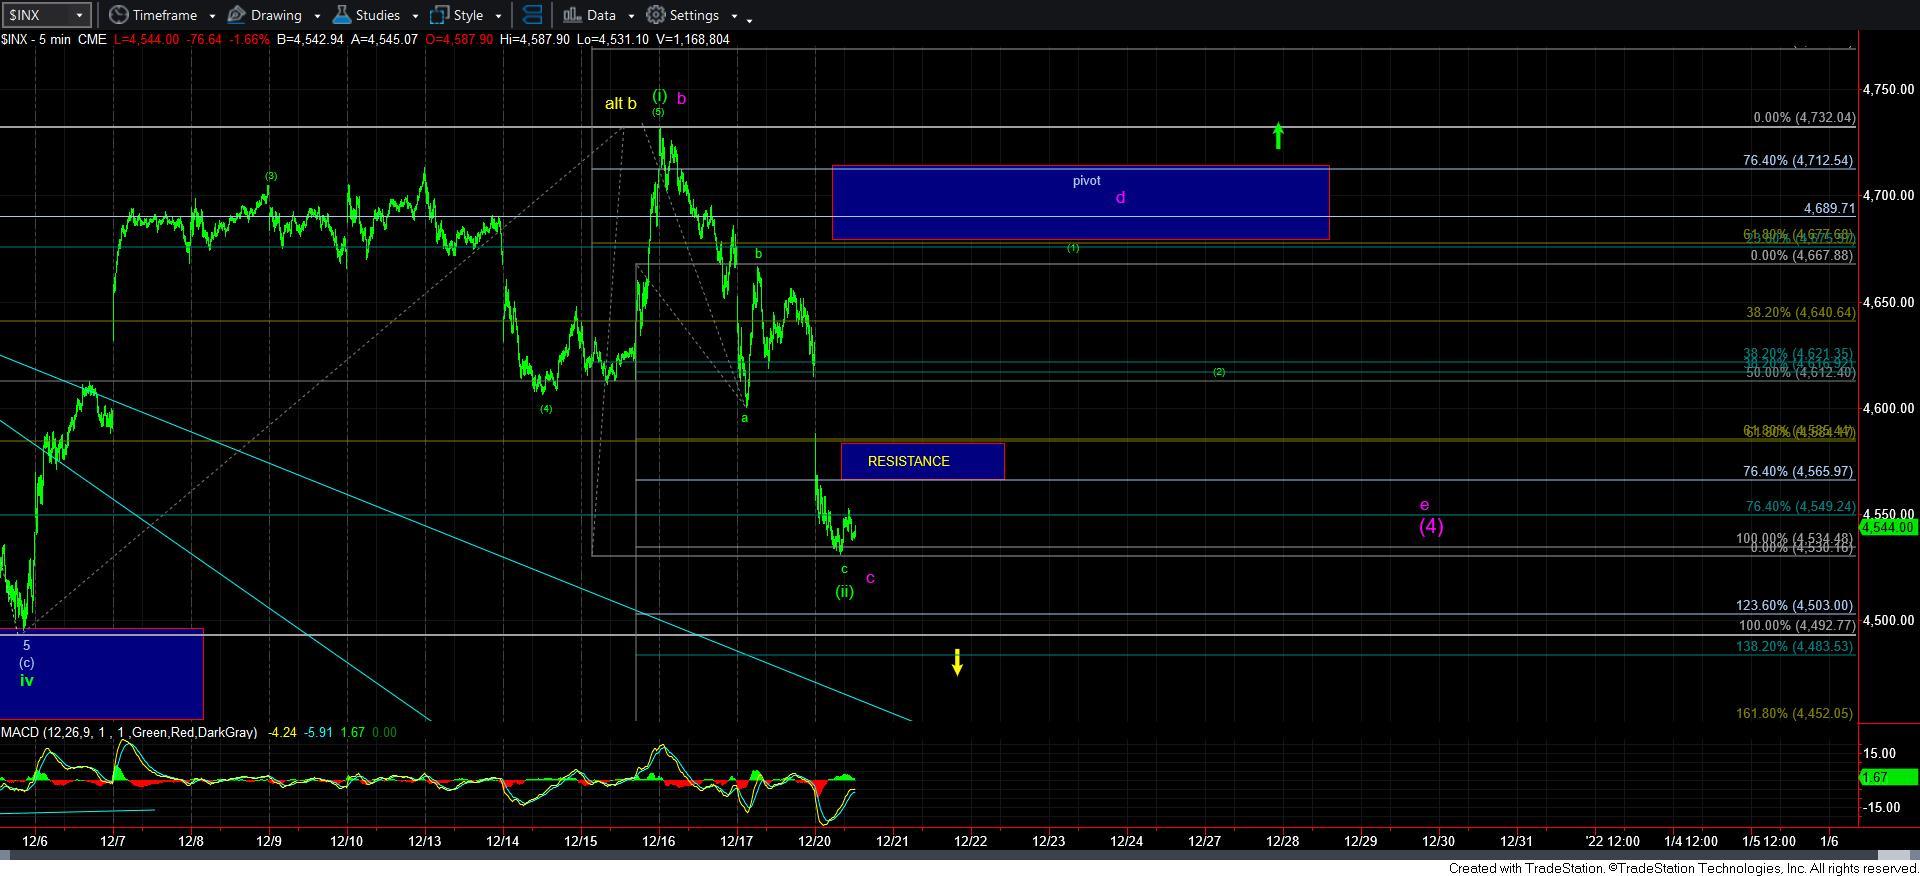
With the market breaking down below the 4550SPX support, this has increased the probability for wave [4]. So, let’s go through the parameters so we know what to look for this week. But, based upon the current structure, I am now assuming that we will finally see a resolution of this complex region within the next week.
As I just noted, the fact that the market broke below 4550SPX does not invalidate the green count, but it does increase the probability of the wave [4] count. Most specifically, the probability for the triangle count has increased, whereas I am still quite skeptical of the yellow count.
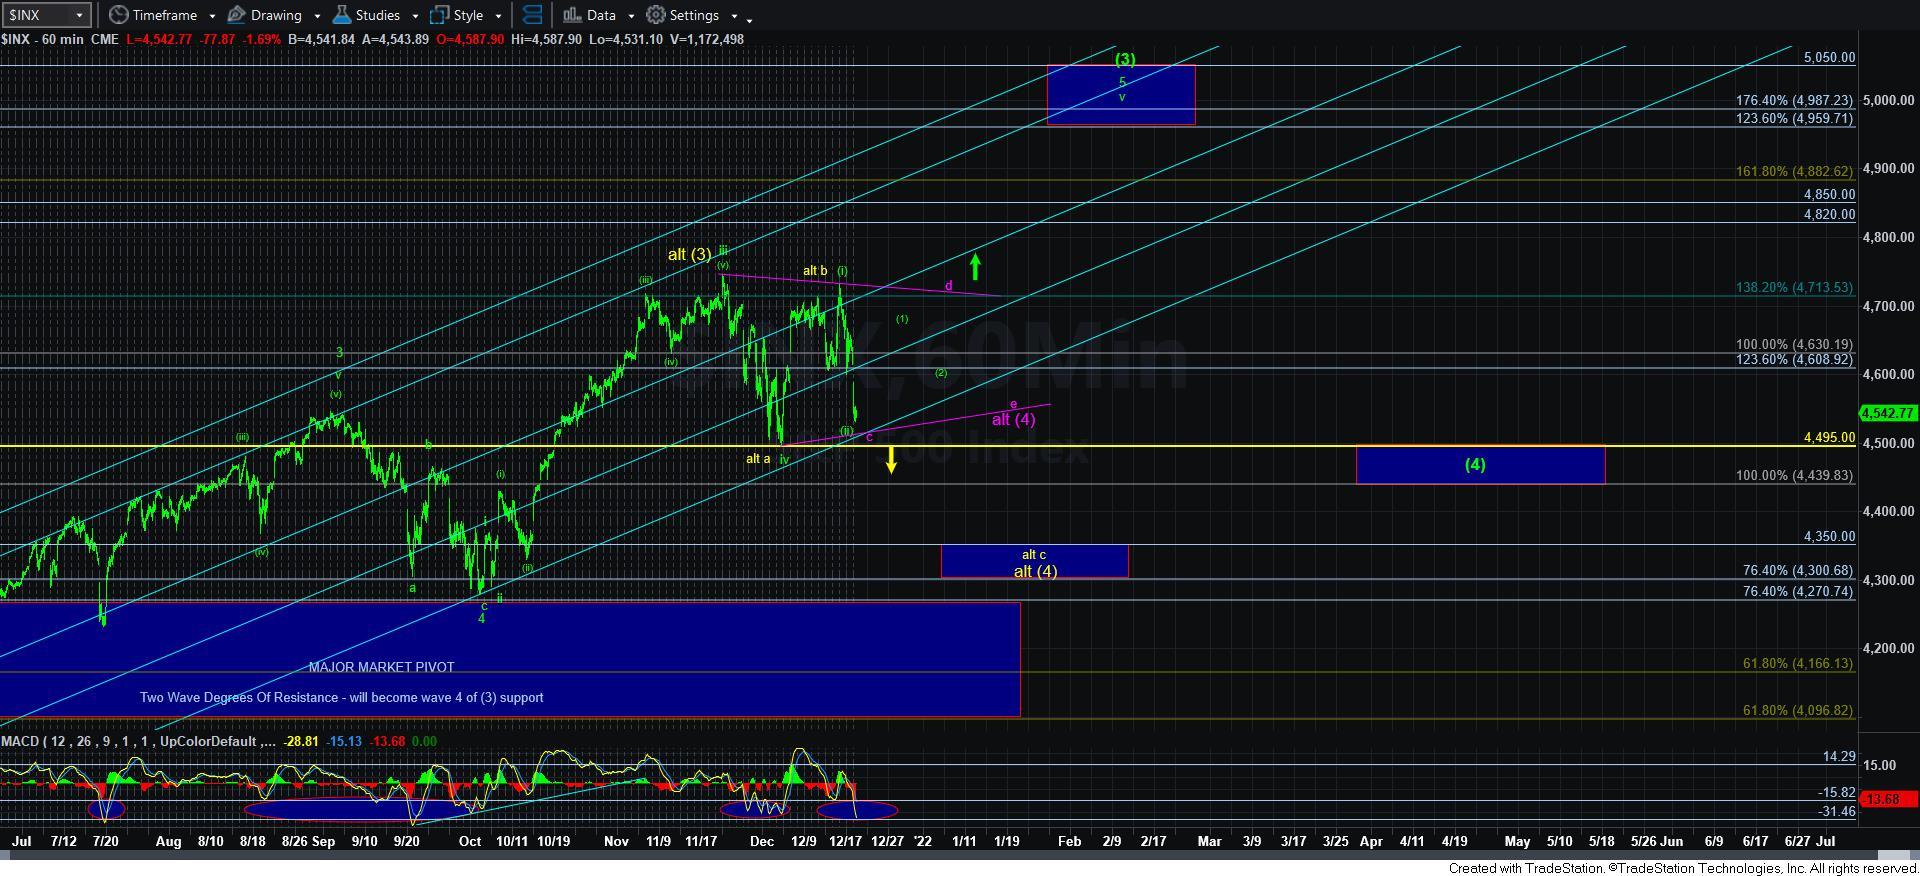
First, as I noted as we were developing the rally off the early December low, I was expecting that a wave [ii] pullback would likely be deep in order to keep us within the larger degree parameters for wave 5 of [3] on the 60-minute chart. In fact, I have noted many times that the 4960SPX region is the ideal target for the larger degree wave [3] of [iii] off the March 2020 low, and a wave [ii] this deep does point us right into that region.
Second, due to the depth of this pullback, it can easily also be the c-wave of the purple triangle that I have been tracking of late.
Third, while the yellow count is still on my charts, I am still viewing it as the lesser likely potential from the 3 patterns we are now tracking.
So, of course, the question is how we will distinguish between these three counts over the coming week?
Well, I have added a resistance region on the 5-minute SPX chart. If the yellow count is going to increase in probability, then the market is not going to exceed that resistance, and will then break down below the 4500SPX region. Should that occur, then I would be looking for a drop to at least the 4400SPX region, but with a more ideal target in the 4300-4350SPX region. But, again, I am not seeing this as the highest probability as long as we remain over the 4500SPX region.
Should the market be able to exceed that resistance box (with the top being in the 4585SPX region), then the structure of that rally will tell us if we are dealing with the green or purple count. If the rally is clearly impulsive, then I remain in the green count, and will be looking for that [1][2] set up pointing us to 4900+ in the coming weeks.
However, if the next rally is clearly corrective in nature, then I will likely adopt the triangle for the larger degree wave [4]. Of course, the question then becomes how high will wave [5] of [iii] take us? My minimum target has to be the 1.382 extension off the March 2020 low, which is the 5163SPX region. But, the better target still remains the 1.618 extension off the March 2020 low, which is in the 5500SPX region. And, waves 1 and 2 within wave [5] will give us a strong indication as to just how high the next major rally will take us in 2022.
So, to summarize how I am seeing the current structure, let’s look at it as 3 points of reference:
1 - Resistance is now 4585SPX with support in the 4500SPX region.
2 - We need to break out over the 4585SPX resistance to make the yellow count even less likely.
3 - The structure of the break out through 4585SPX will provide us with the applicable wave count in this region – corrective = purple triangle . . . impulsive = green to 4900+.
4 - If the market is unable to break out over 4585SPX, and breaks down below 4500SPX, then we are likely heading down to the 4300-4350SPX region in the yellow count. (For now, this remains the lower probability).