Looking For Resolution - Market Analysis for Jul 5th, 2018
All we saw today is simply more sideways action, with the SPX tracing out what certainly “looks” like corrective action to the upside and downside.
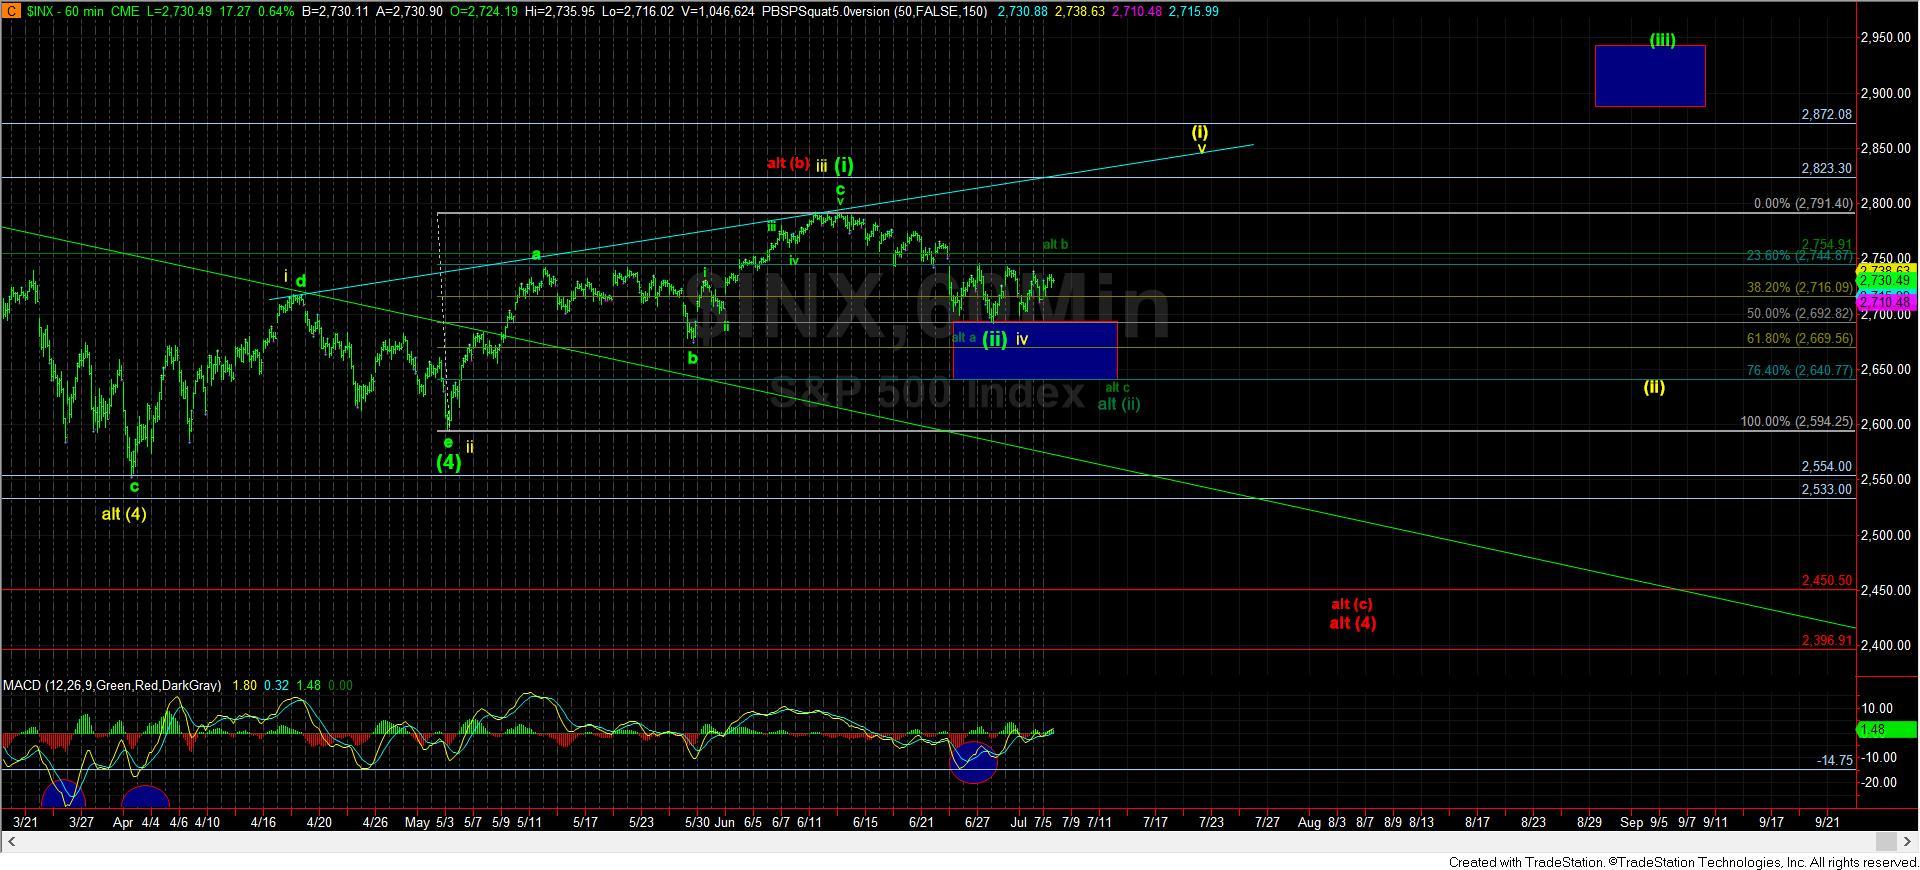
Normally, when I see corrective action on the way up, I would automatically be looking for this pattern to resolve lower. However, since the two bullish potentials in the SPX chart would both see overlapping structures taking us higher (leading diagonal in yellow and ending diagonal in green), overlapping structures do not give us the usual clarity they provide regarding impending market action.
However, the market still has resistance and support regions which will provide us appropriate guidance. Overhead, we have a confluence of many resistance points located between 2747-2754SPX. Until we are able to move through that resistance region, the darker green count will remain as a potential on the chart. Moreover, as support on the SPX resides at least week’s low of 2699SPX, a break down below that level would likely suggest the darker green wave (ii) is the likely pattern we will be following.
So, until the market makes its decision in the coming day or two, the overlap makes it quite difficult to discern the markets near term intention. While we still expect that the market is setting up for its run to 3000, whether it will do so in the green or yellow counts is still unknown, and will likely take another week or two to determine.