Looking For A Near Term Bottom
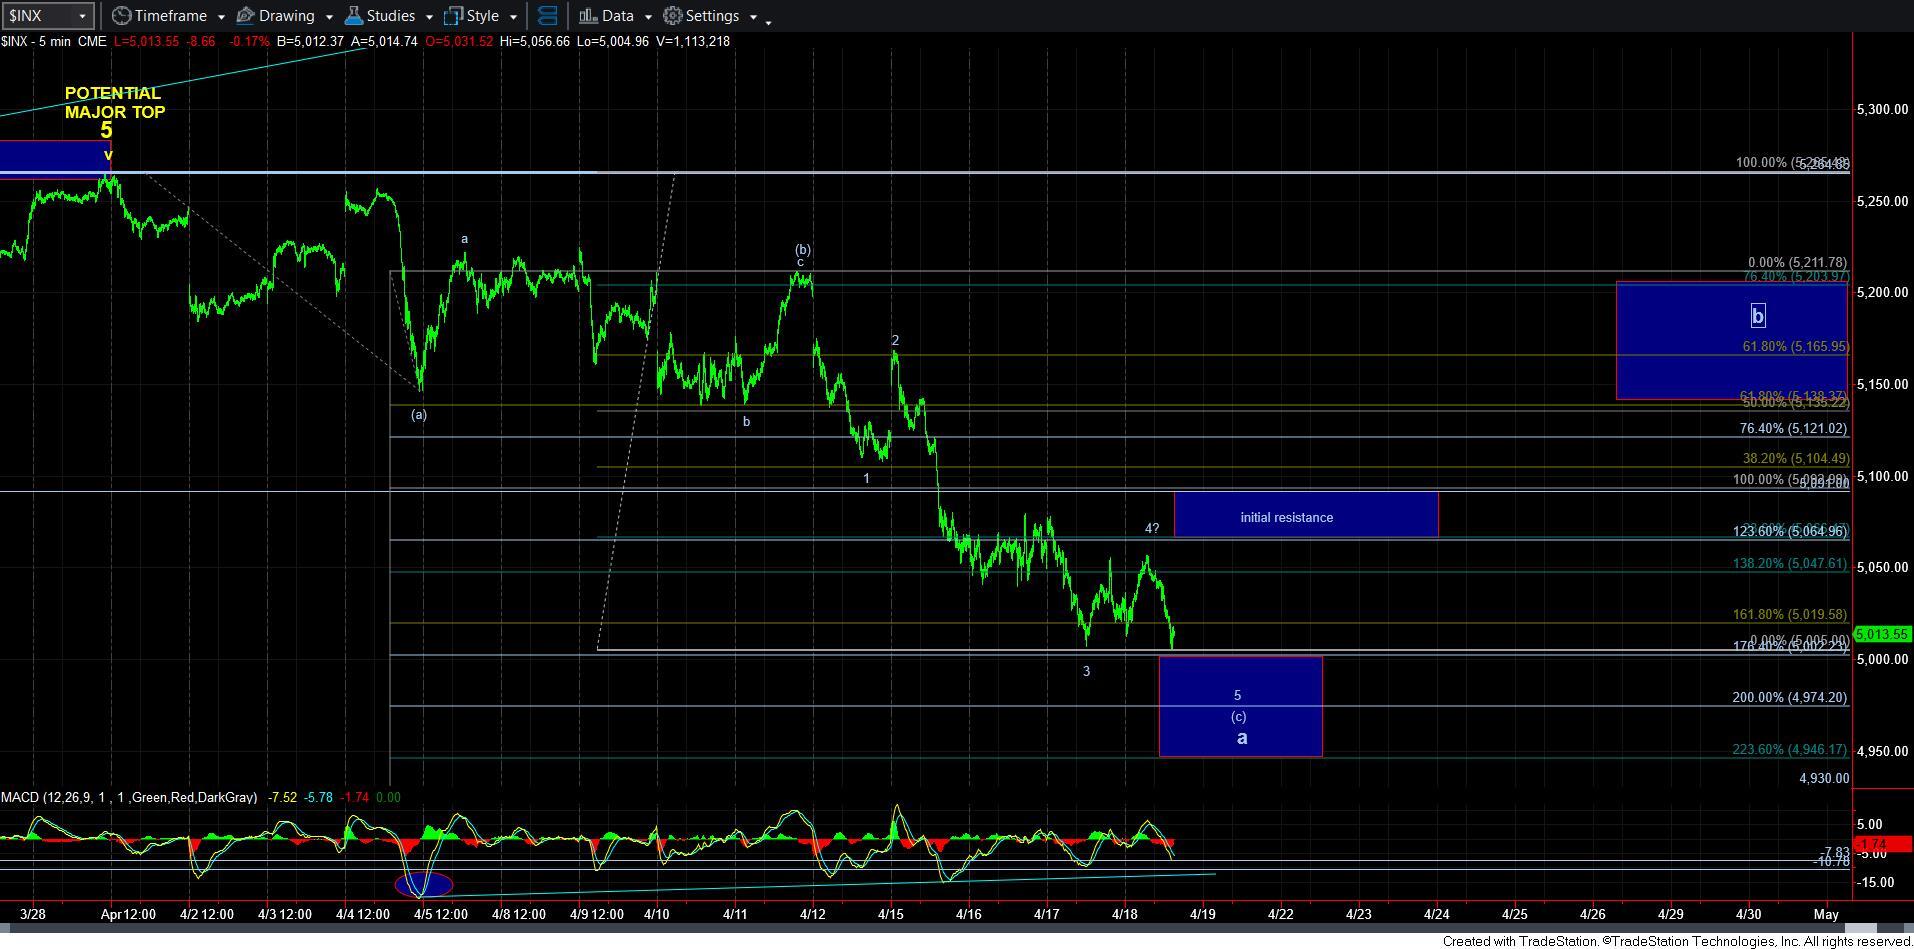
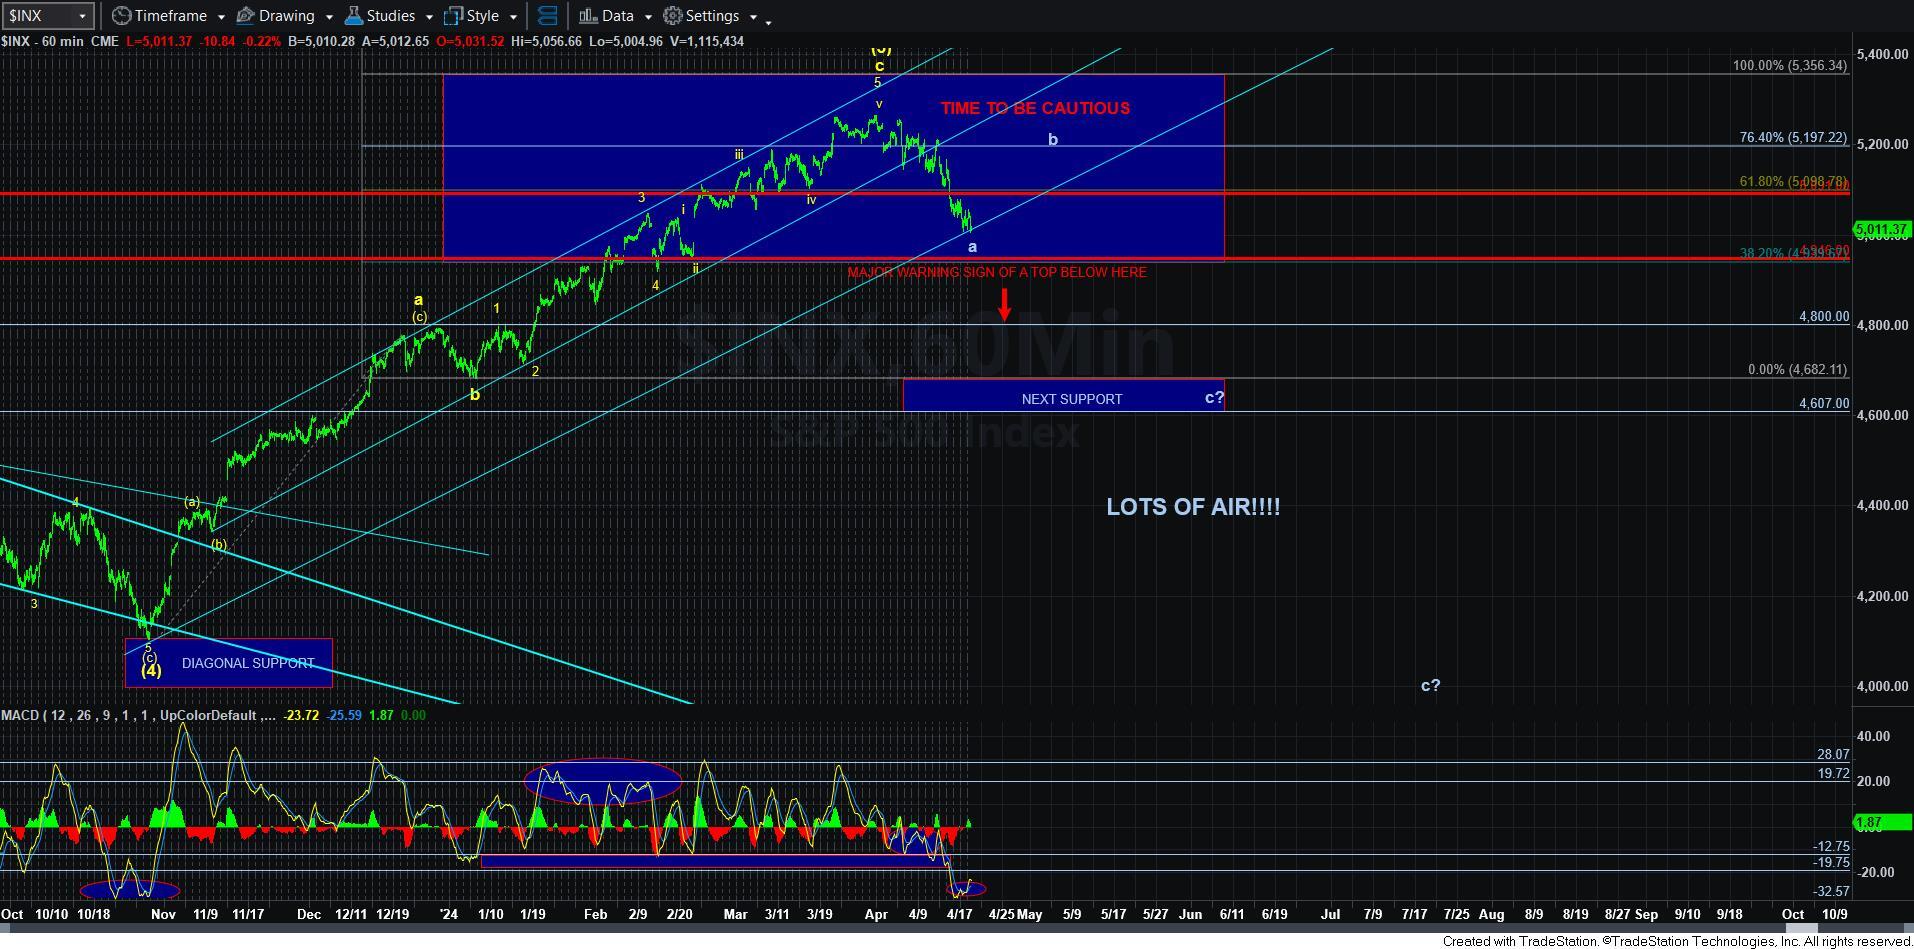
With the market break-down below 5091SPX, I have noted my preference for viewing the top as having been struck, which now makes this decline an a-wave. And, I have highlighted the expected support for where I believe the a-wave can bottom on the 5-minute SPX chart, the top of which we are hitting right now.
Overall, I do not expect that we will break down below 4946SPX in this initial decline. Of course, if I am wrong, then we may see a much larger decline than I currently expect. But, for now, there are many indications that suggest that we should be bottoming in the support box outlined on the 5-minute SPX chart.
I have also added an estimated b-wave target. Yet, until we actually confirm a bottom is in place, it will be adjusted should we head deeper into the box.
I have also added an initial resistance region box, for which the top of that box represents the former support, which now becomes resistance – 5091SPX. Through this box, and it makes it highly likely that we are in a b-wave rally.
Since b-wave rallies take shape as corrective structures, I am expecting an a-b-c structure for that rally. And, since a-waves are most often 3-wave structures, I am expecting the initial rally to be a 3-wave structure. Should I see a 5-wave structure begin the next rally, I may have to consider the potential for a higher high as an alternative wave count. But, for now, clearly I am not seeing that as a high probability.
So, overall, I am expecting some bottoming action in the very near term, and I think we will likely see a rally into next week, as long as we hold over the 4946SPX support.