Long Side Has Become More Dangerous In The Intermediate Term
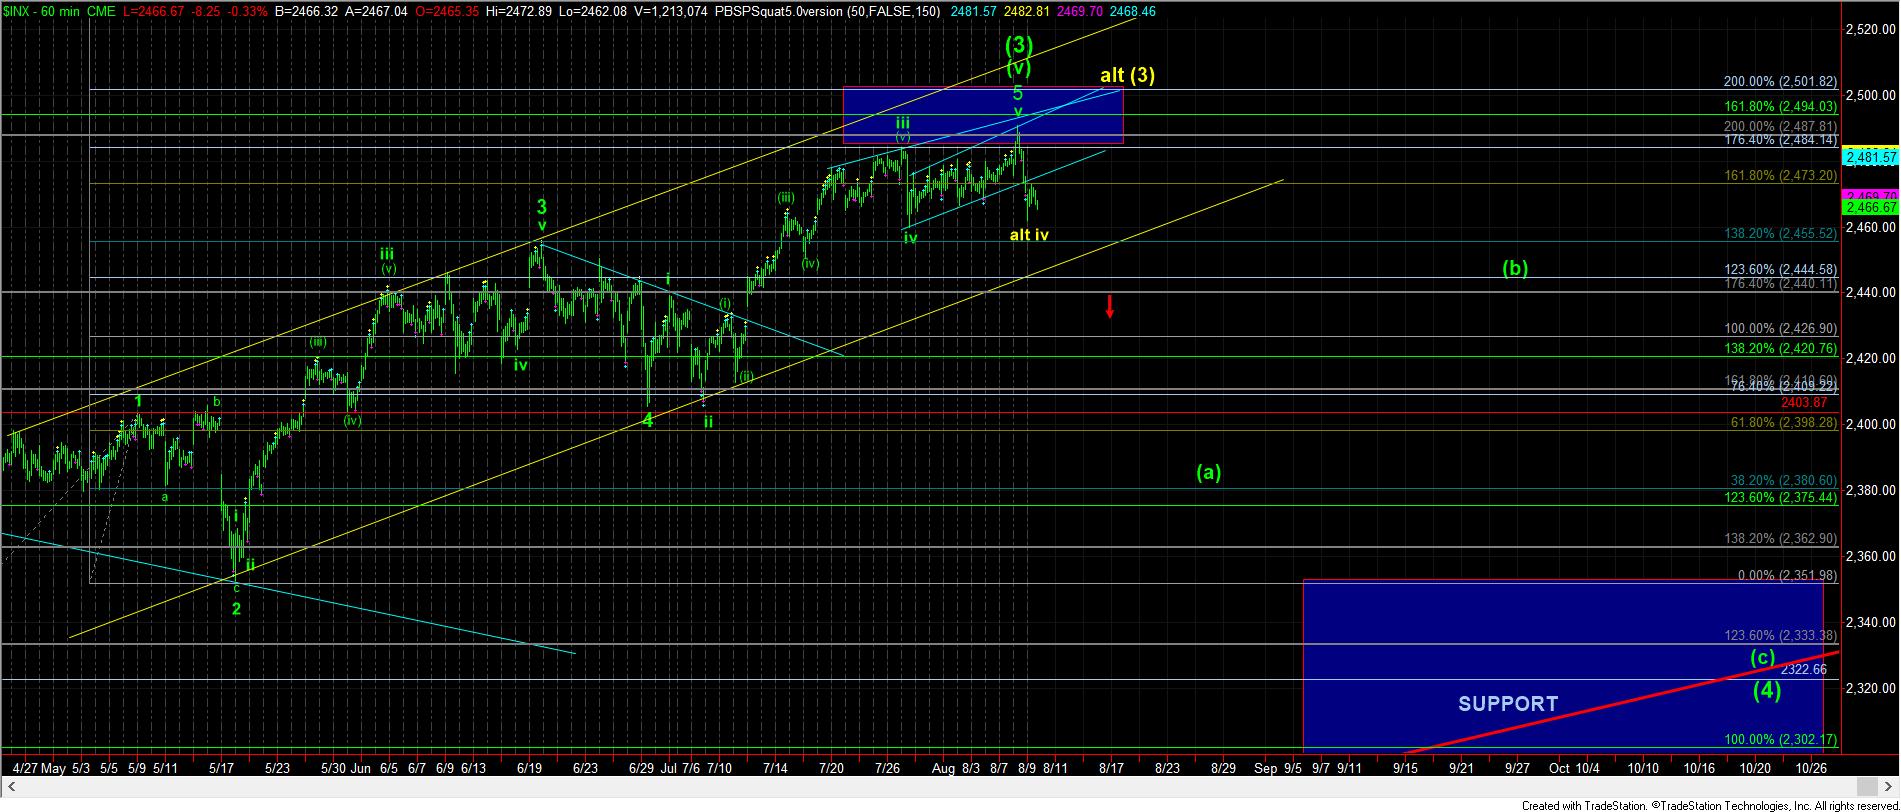
When an ending diagonal completes, the market reverses strongly back down to where the ending diagonal began. In our case, that is the 2460SPX region, and the market has just about struck our target region.
So, where does that leave us? Well, since the market reacted the way a completed ending diagonal normally would, and we have struck our target on negatively divergent technical indications, I believe our primary perspective should be that the market has topped out in wave (3). So, that is how my chart is currently annotated.
Yet, I cannot say that I do not retain some question in my mind as to whether the market may try to stretch one more time for that 2500SPX region. Moreover, since bull markets do not easily give up, I at least have to maintain an alternative count that we can rise one more time to attempt a strike at the 2500SPX region. Yet, I view the risks of trading such a potential as quite high, and would only suggest day trade-type trades for those even nimble enough to attempt such trades. For most market participants, it means that the long side may be too dangerous in the short term to attempt.
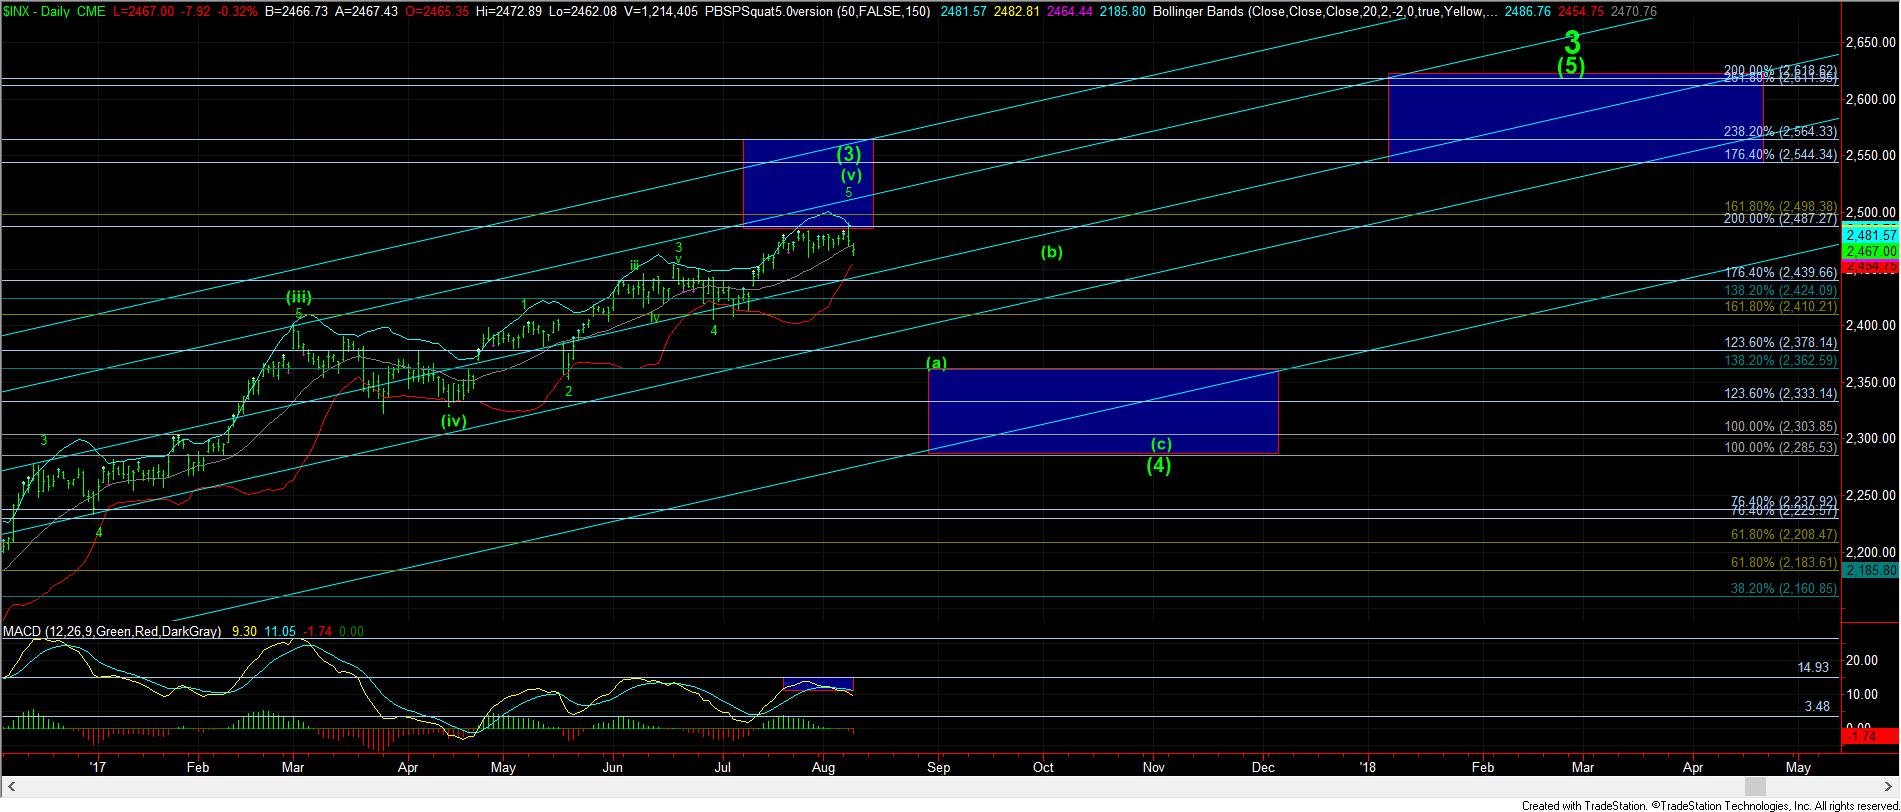
That brings me to a brief discussion of an overall perspective I believe one should take now. While there is still some possibility that we can still rise and strike the 2500SPX region before wave (3) does complete, I would suggest that the reward is clearly not commensurate with the potential risk. Rather, a-waves in a 4th wave often start with a bit of a shock to the market, and often come with very bearish news accompanying them, which can propel them lower at my more rapid speeds than most would expect. Remember, 4th waves have to re-set sentiment to a bearish extreme so that we can rally in a 5th wave, with such bearish sentiment acting as the fuel for such a rally. Bullishness will only develop the next extreme as we complete the 5th wave, likely in 2018.
Moreover, for those that are not familiar with the Elliott Wave structures yet, a 4th wave is the most variable of the entire 5 wave Elliott structure. That means there is only one thing you can expect in a 4th wave - WHIPSAW. That means that most market participants are not meant to attempt to trade within a 4th wave, as the variable nature of the moves often chop traders up. In fact, many traders will lose a significant amount of their profits earned during the 3rd wave getting chopped up while attempting to trade a 4th wave.
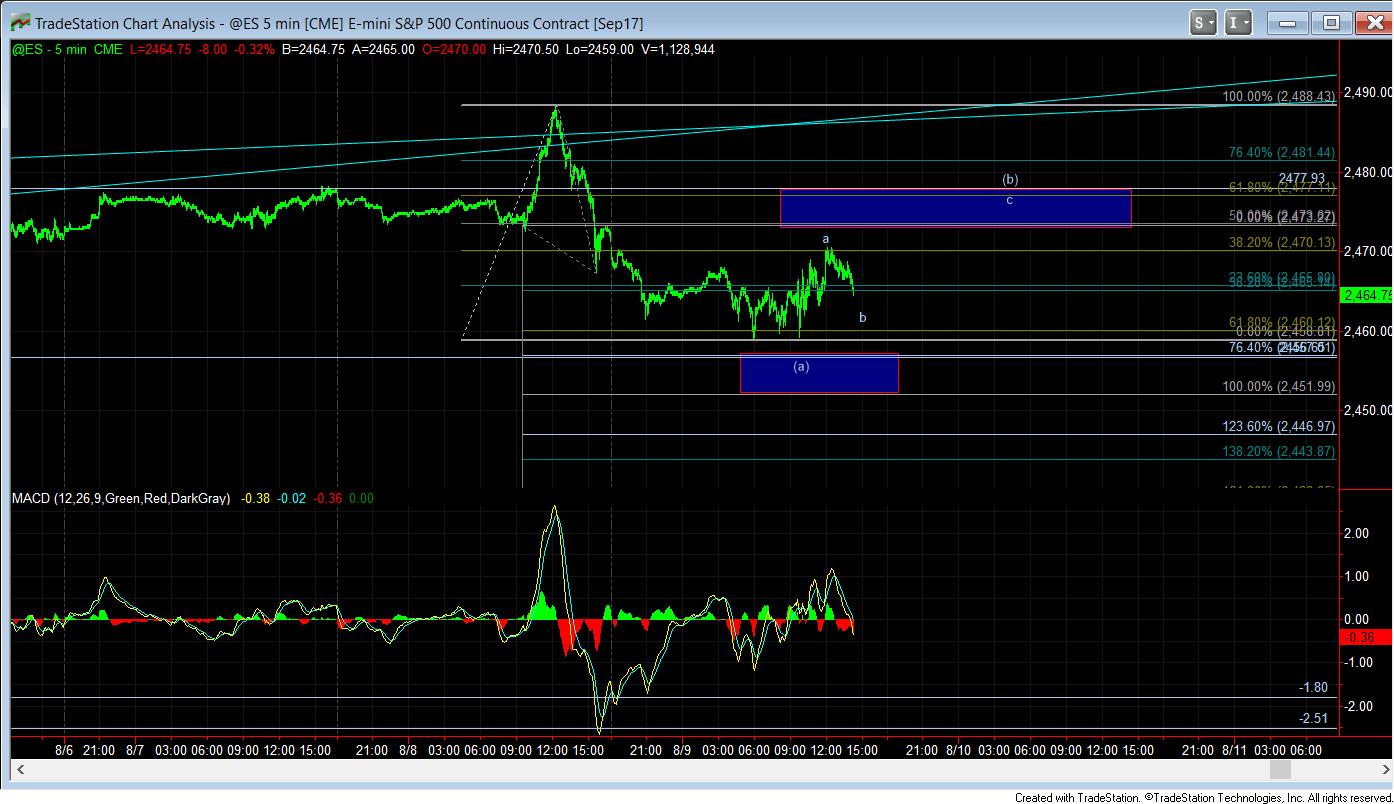
This evening, I have included a micro ES chart I posted very early this morning, which has been filling out quite nicely as I laid out early in the morning. The overall gist of this chart is that as long we remain below the blue resistance box overhead, the market is set up to drop strongly to test the next support zone in the 2440-50SPX region. While the ideal structure can still take us up one more time to test the upper box, as long as we do not break through that box, my expectation is to continue lower to test the next important support region. Once we break below the next lower support region between 2440-50SPX, that confirms that we are in wave (4), which should ideally take several months to complete.