Lines In The Sand Have Been Drawn In TLT
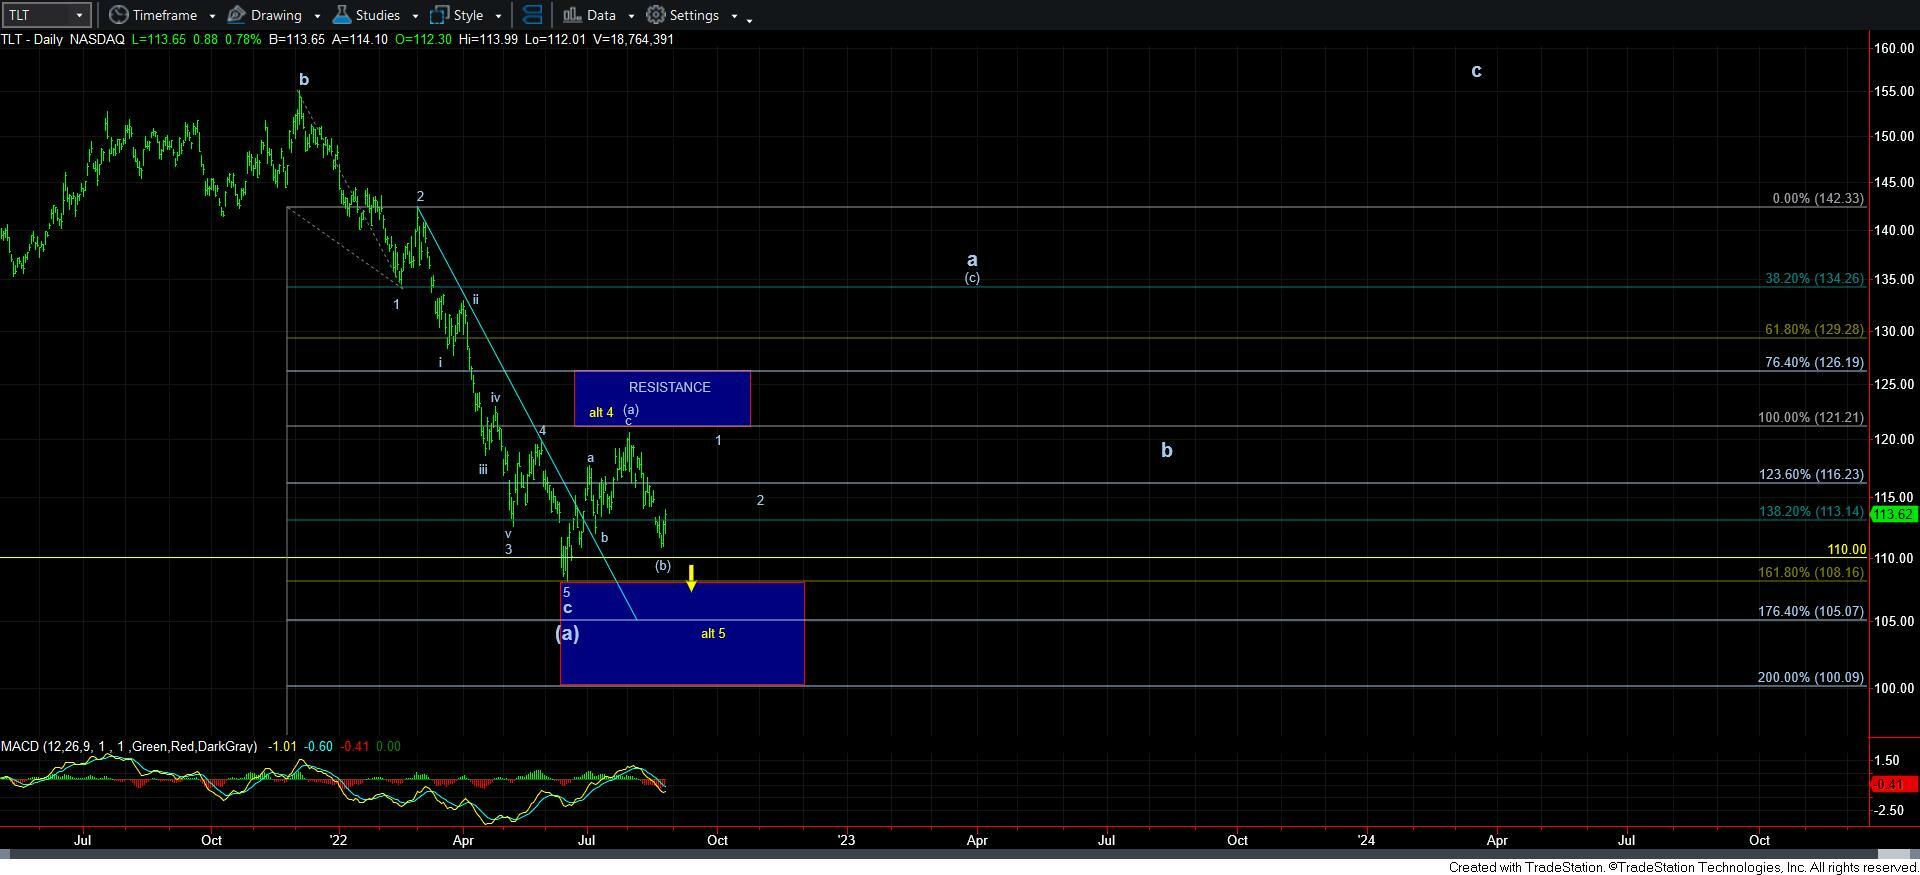
The 110 level is now our line in the sand. As long as the market is able to hold over that – even if we do see another lower low in this current decline – and provide us with a clearer 5-wave structure for wave 1 of the [c] wave of the larger degree a-wave rally – then we can begin to turn more immediately bullish after the market provides us with a corrective wave 2 pullback. I have added the estimated pattern on my chart, as you can now see.
However, if the market is able to break down below the 110 level in TLT, then I think we have an ending diagonal taking shape for wave 5, which probably still has to complete its 3rd, 4th and 5th waves before it completes, with a break down below 110 likely being the c-wave of wave 3 in its final 5th.
So, I think the lines are drawn, and it will not take too much longer to know our path for the rally I expect in TLT as we look towards 2023.