Likely Downside Still To Come – But, Which Path?
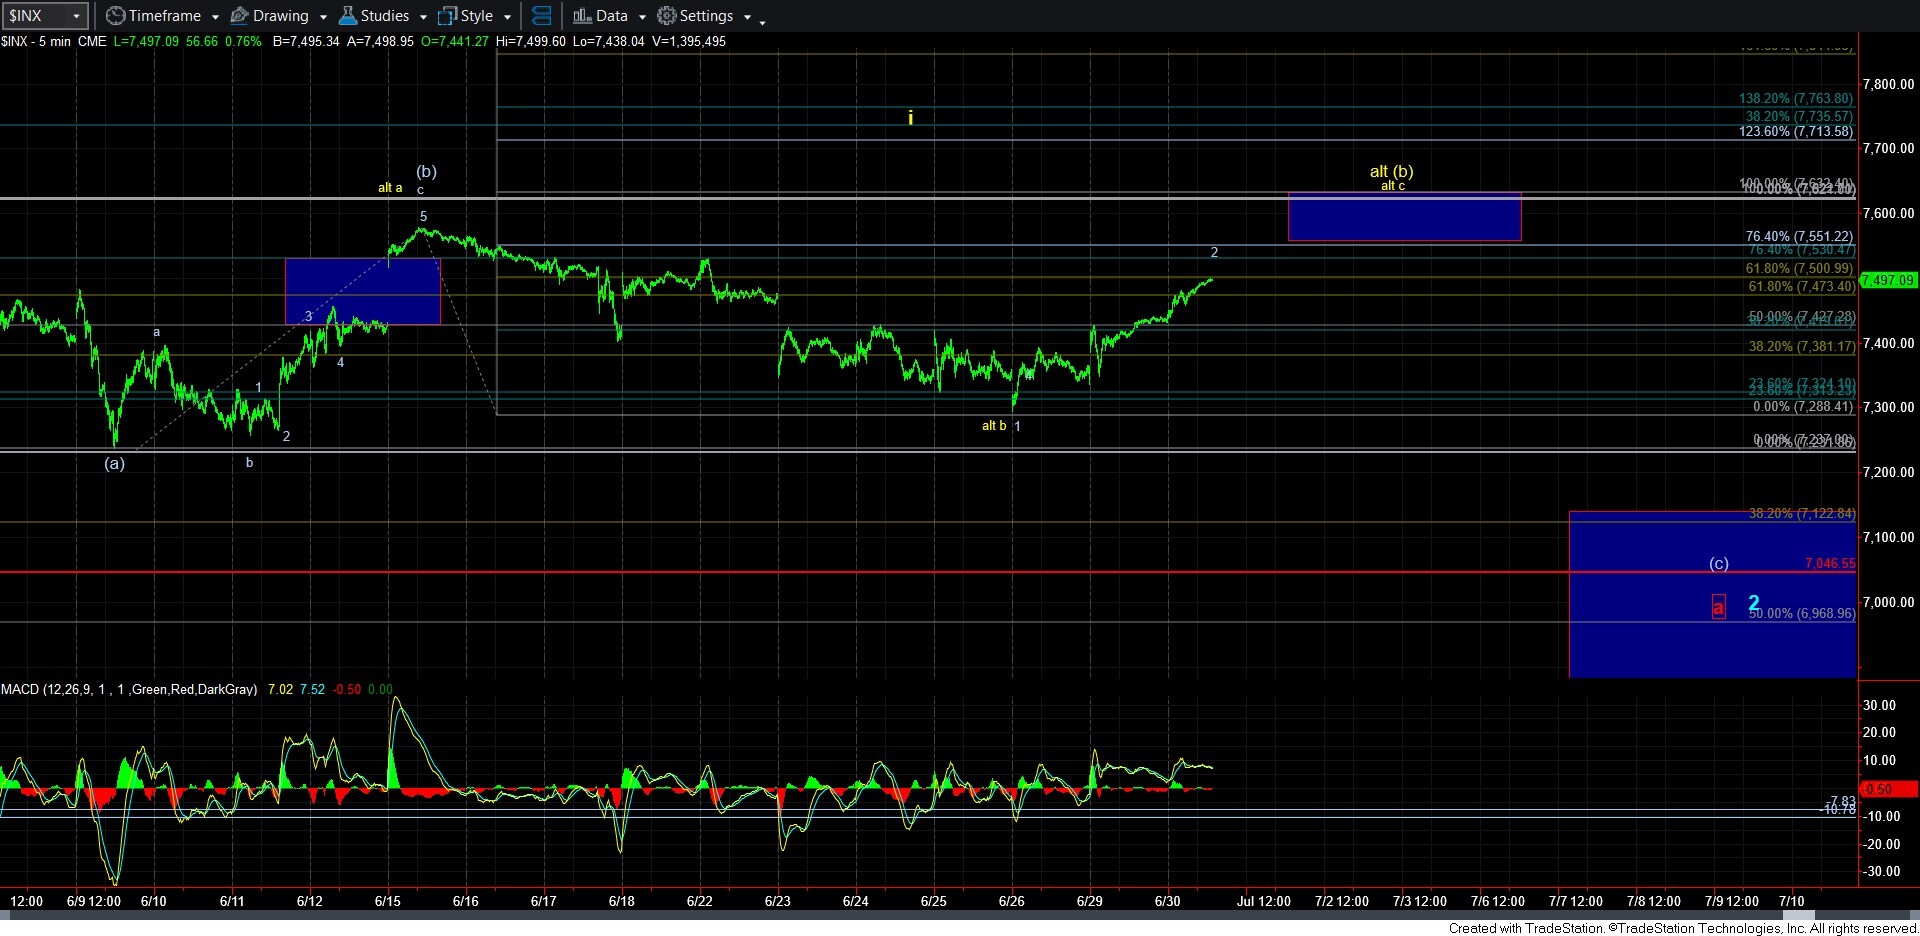
With the market pushing a bit higher today, I have taken off the 1-2, i-ii structure, and instead, have moved to a 1-2 structure in an ending diagonal for the (c) wave, with us still working on the wave 2.
The alternative is still the yellow count, for which I have added a resistance box at the .764-1.00 extensions, wherein the c-wave in the yellow (b) would be equal to .765-1.00 the size of the (a) wave.
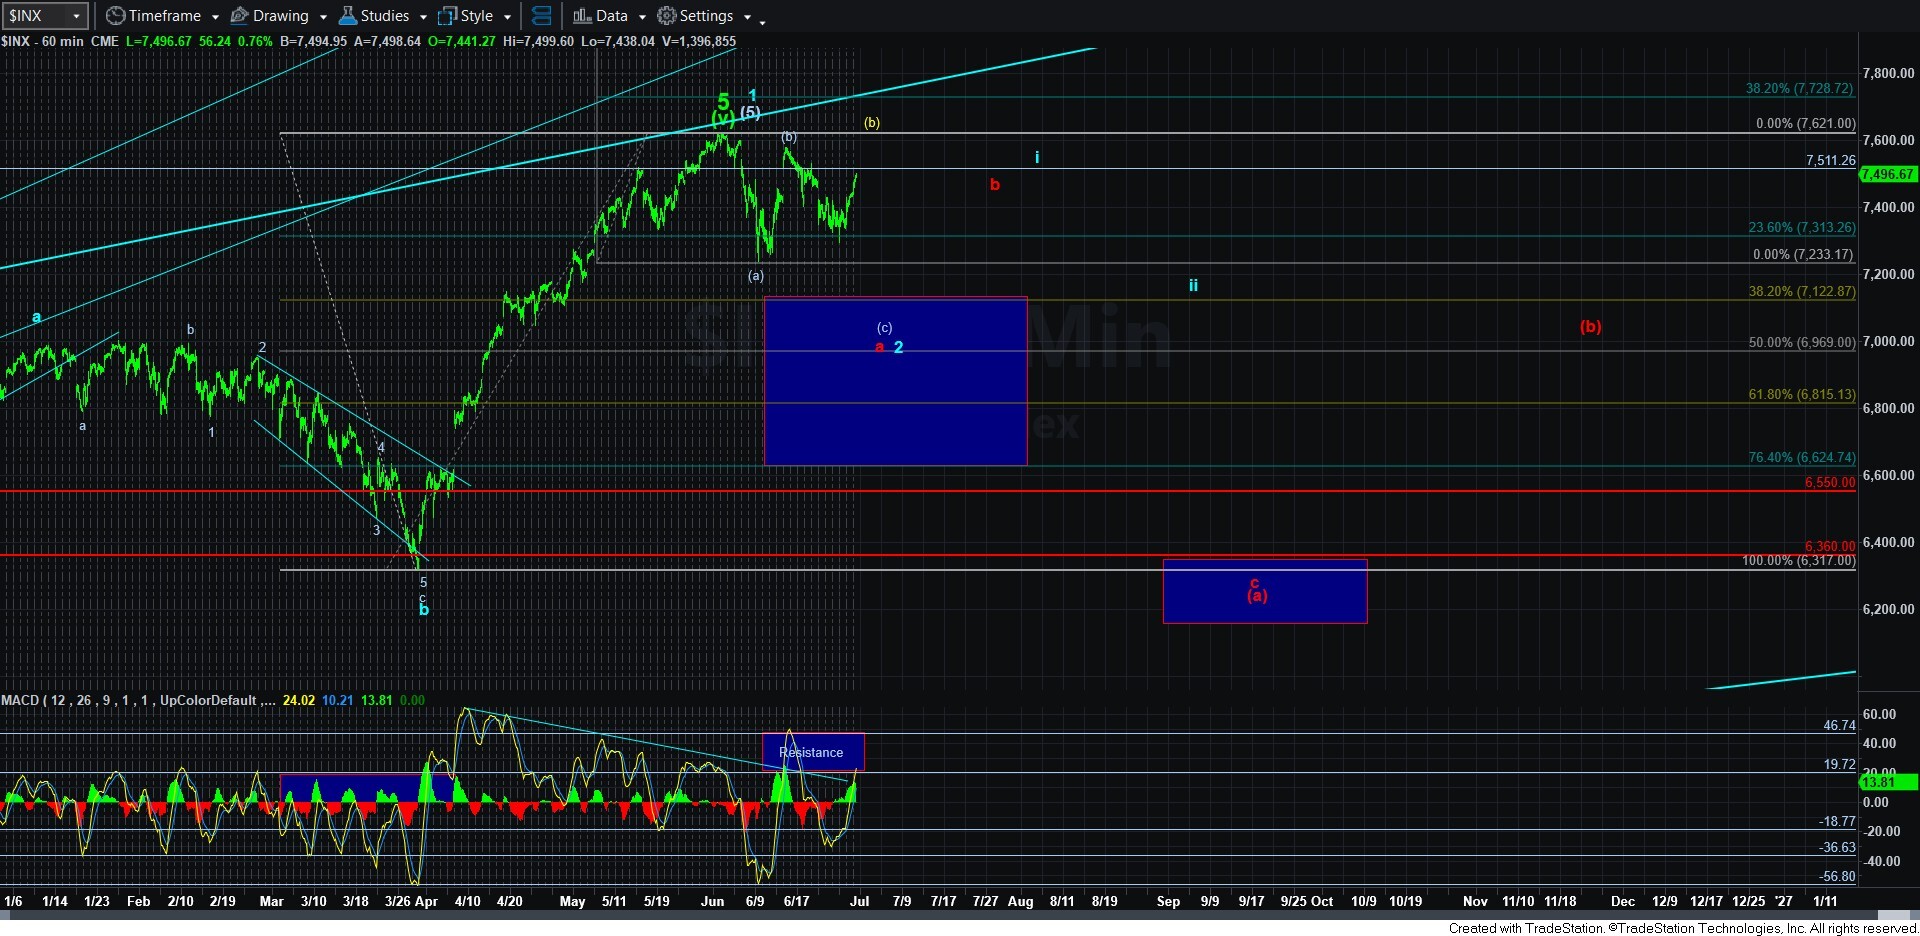
What these two facts suggest is that the next 150 points overhead (as the alternative (b) has the 1.00 extension in the 7650SPX region) represents a lot of risk. I am reasonably expecting the market to top out within the next 150 points higher, and present us with one of two paths to the target/support box below.
The 1-2 structure would be pointing us to the middle to bottom of the box below, whereas the yellow count probably points us to the top of the box.
The other point I could make is that the decline from the 1-2 structure will likely start out looking like a corrective decline, as it would be an a-wave in wave 3 in the diagonal, which are most commonly 3-wave structures. Clearly, this makes the analysis much more complex in trying to identify a high probability set up and structure. However, if we do rally up to the yellow target, then we would expect a 5-wave decline, the bounce from which can be shorted, with a stop at the high of this rally with a bit more probability backing that structure.
Clearly, the market is not trying to make this easier. But, as long as we remain below 7650SPX, I am still looking for a sizeable decline.