Let’s Try To Remain Objective
This market has now been stuck between 4050-4195 for the better part of the last month and a half. Yet, we do have a set up which presents us with an opportunity for it to finally break out to the upside. Whether it takes that path is a question I cannot answer with certainty. But, I will reiterate that this is the way I am still seeing the market, at least as long as we continue to maintain support.
Moreover, not only have we been holding support, but downside moves have mostly been corrective in nature, providing us with 3-wave structures. So, without any clear evidence of a 5-wave decline, I have nothing that is clearly alerting me to the potential of a break-down of support. Therefore, based upon logical deduction, it leaves me looking higher for now.
Before I provide the specifics to the analysis, I would like to touch upon a point I made earlier today in the trading room at EWT.
I know many of you read articles on economics, as well as debate whether we have a hard landing or soft landing. But, in my humble opinion, I think you are wasting your time. Attempting to align economics to the stock market is often an exercise in futility.
As Bob Prechter clearly outlined in his seminal book The Socionomic Theory of Finance, whereas the law of “supply and demand operates among rational valuers to produce equilibrium in the marketplace for utilitarian goods and services . . . [i]n finance, uncertainty about valuations by other homogenous agents induces unconscious, non-rational herding, which follows endogenously regulated fluctuations in social mood, which in turn determine financial fluctuations. This dynamic produces non-mean reverting dynamism in financial markets, not equilibrium.”
Moreover, since the efficient market hypothesis (the basis for fundamental analysis in financial markets) is an outgrowth from the world of economics, it has become quite commonly viewed as an unworkable paradigm for financial markets for various reasons. Understanding that an underlying assumption within economics is ceteris paribus, and an underlying assumption in the efficient market hypothesis is that all investors act rationally and with the same knowledge, you can easily understand why it is simply unworkable in financial markets.
In fact, Benoit Mandelbrot outright stated that one cannot reasonably apply an economic model to the financial markets:
“From the availability of the multifractal alternative, it follows that, today, economics and finance must be sharply distinguished . . .”
Moreover, when you read analysis on the economics of our situation, it can often lead you to a conclusion that may not align with the stock market. That will cloud your objectivity when reviewing the charts and analyzing the most important factor when it comes to the stock market - - PRICE.
It for this reason that many have been looking down ever since we bottomed in October of 2022, whereas we have been appropriately looking higher.
Now, will the market top out and drop down to 3000, or 2700, or even 2000? Well, I cannot answer that at this time. Yet, there is quite a bit of certainty “out there” that this will happen. But, I strongly urge you to maintain an open mind so you can be objective as to what price tells us in the coming months.
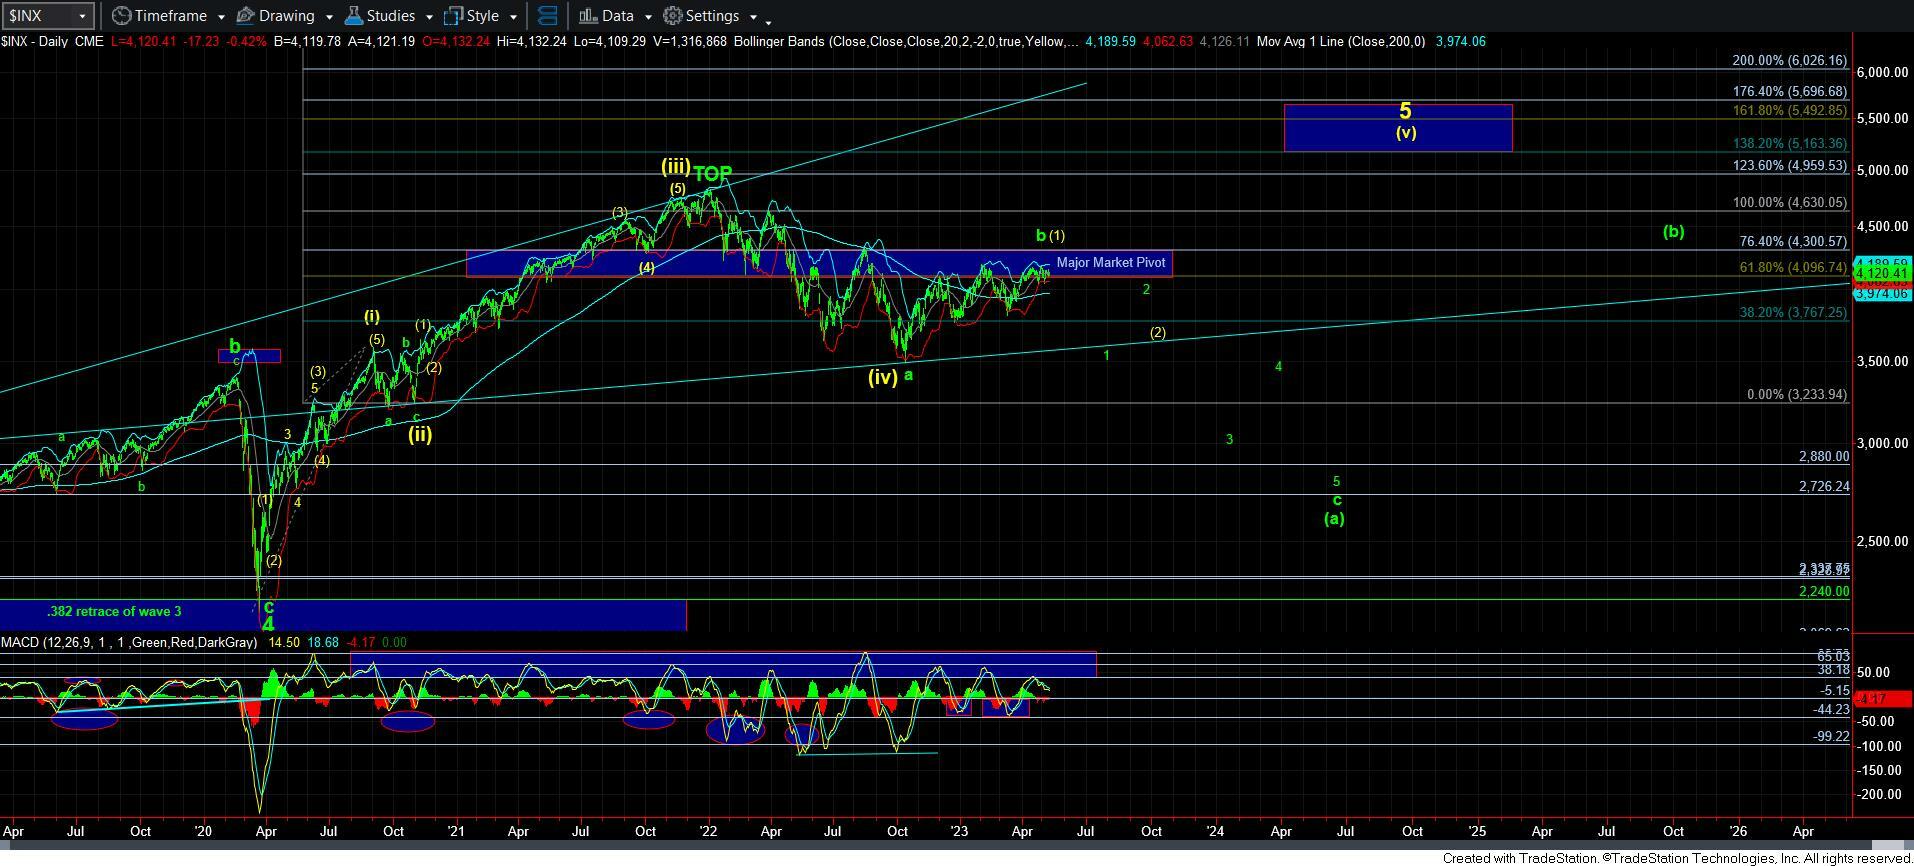
Should the market top out and provide us with a 5-wave decline (as outlined in my daily chart for the green wave 1), then we will prepare (during a wave 2 bounce) for a “crash” in the c-wave of the larger degree [a] wave, which should target the 2700-2900SPX region, as I have had it outlined for quite some time.
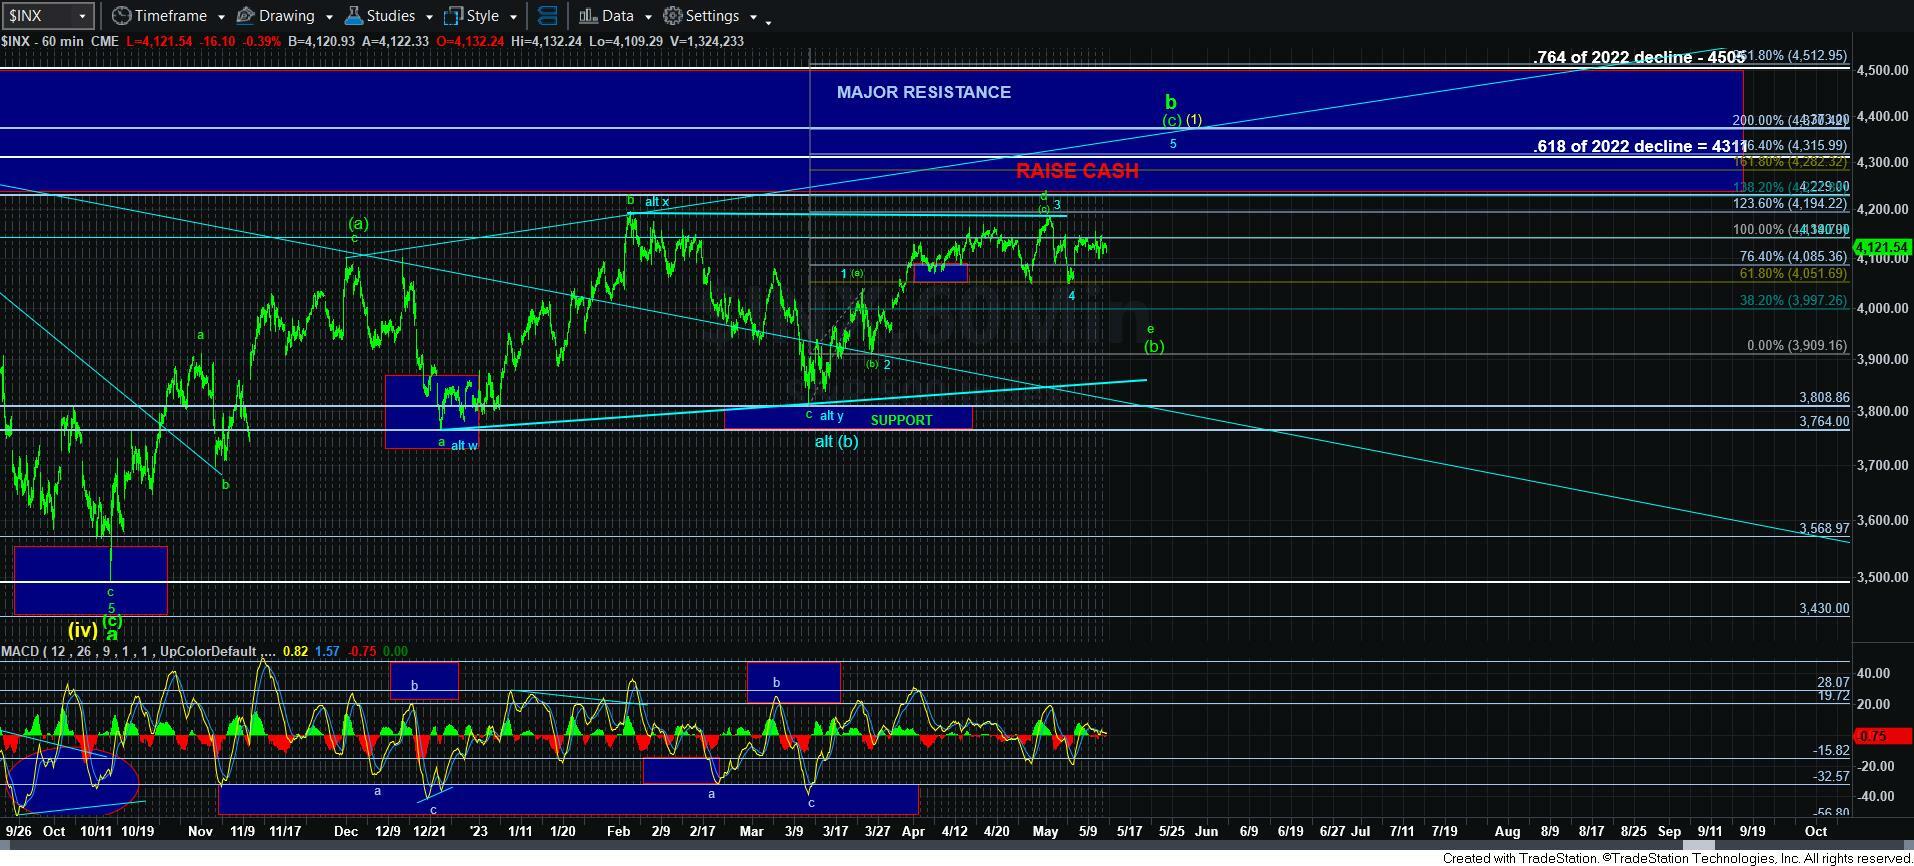
However, if the market does not provide us with that 5-wave decline, then it is likely telling us that we have higher to go, either in a bigger b-wave, or even in the yellow count to a new higher high. Yes, I have been told that considering a higher high is just an impossibility at this time. But, I was told the same thing MANY times in similar circumstances. This again is the reason why it is so important to remain as objective as possible.
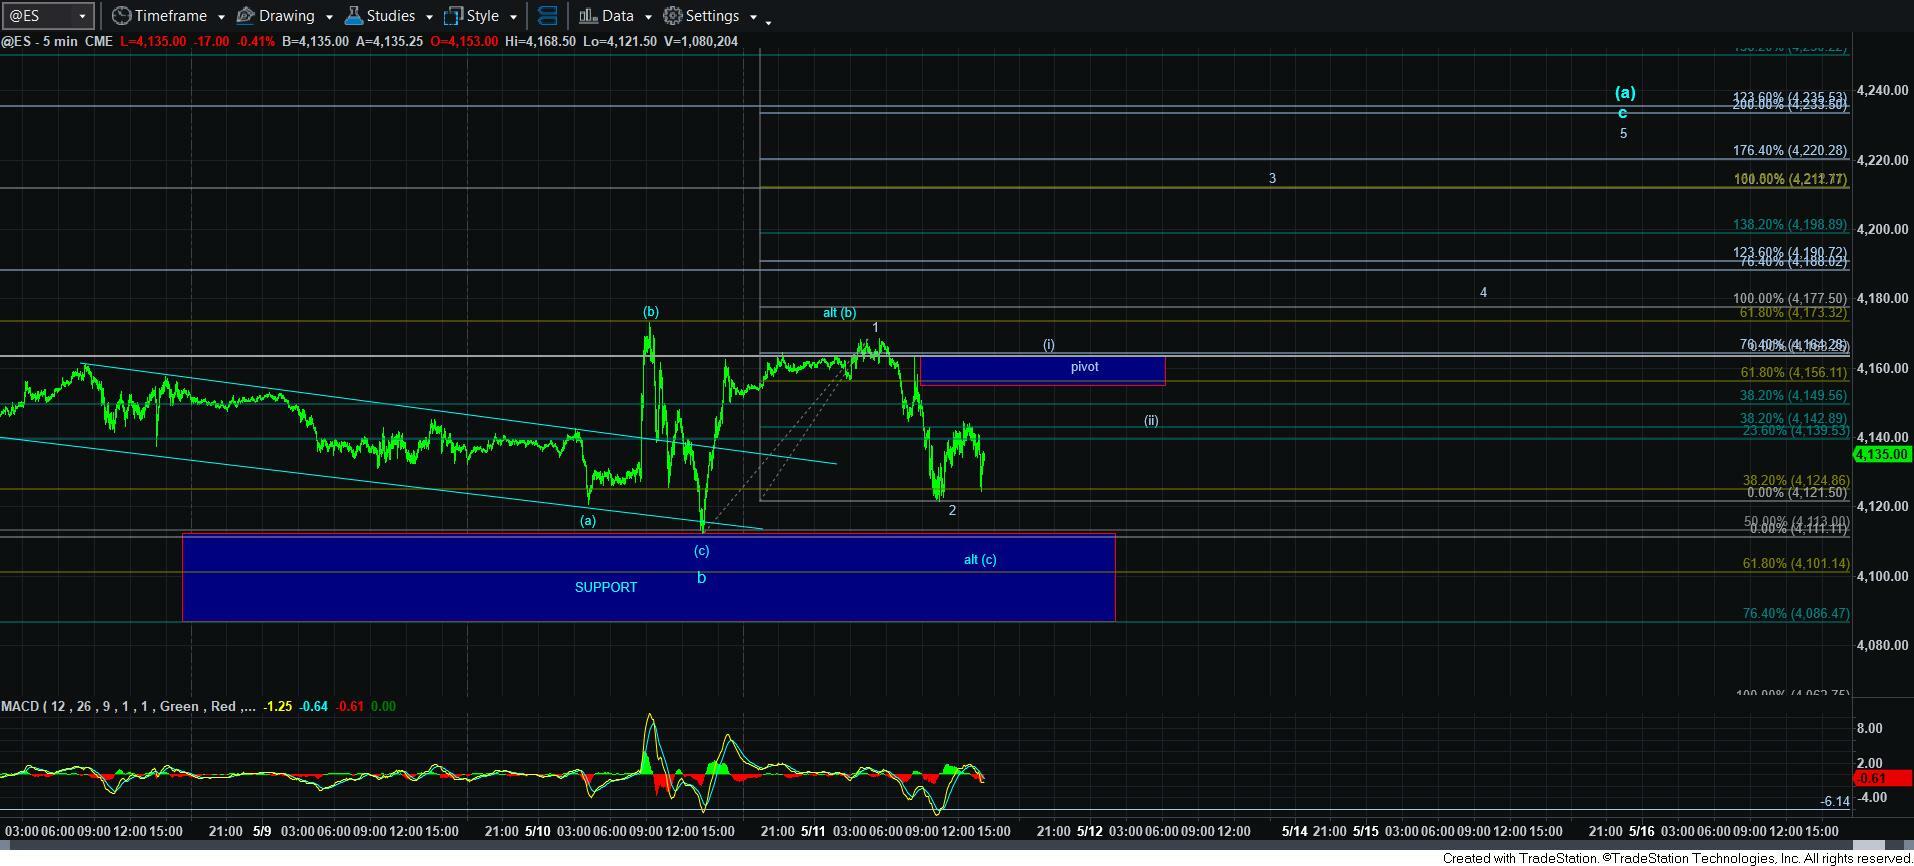
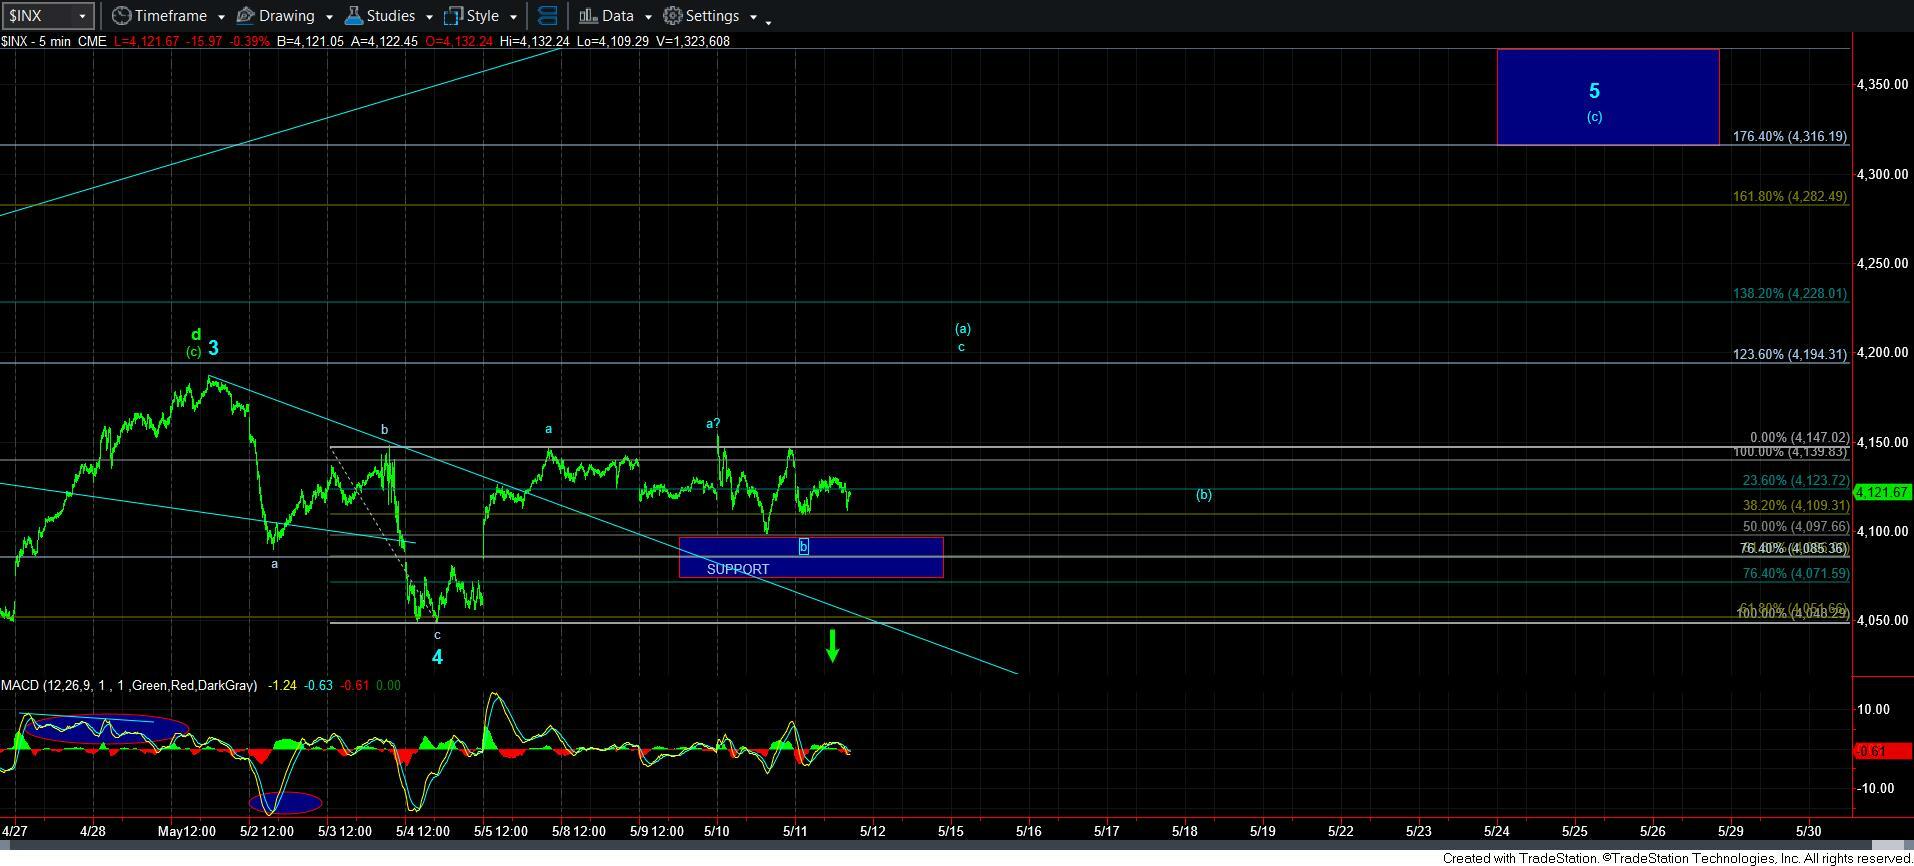
So, in the near term, we have outlined support in the market, as represented by the blue box below price on the 5-minute SPX chart. And, as long as that support continues to be respected, then I am looking for a rally to the 4316-4370SPX region to complete this what we are primarily tracking as a b-wave structure which began in October of 2022. In the micro count, I am seeking a better 1-2, [i][ii] structure to signal that we are potentially breaking out of the current consolidation. But, I personally refuse to chase this market up here if we do not get an appropriate low risk, high probability set up.
Furthermore, it will likely be a few more months before we are able to know - with a higher probability - if the c-wave down to 2700-2900SPX is taking shape. And, until the market tells me that it is, well, I intend to remain objective to price action in the coming months, without regard to the underlying “fundamentals.”
Keep in mind that the “fundamentals” were quite negative and the economists had us in a “recession” during more then 1000 points of the rally off the April 2020 low. Price is the only truth in which I am interested, and I will let it dictate how I approach the market in the last half of this year, and beyond.