Lesson In Corrective Structures
With the market following through to the downside as we generally expected in this set up, we are approaching an important cross roads which will determine if we have a lower low yet to be seen, which is our primary count, or if the bottom has already been struck.
But, before I move into the analysis segment of this write up, and considering all the new members that have joined us lately, I thought this would be a good time to take a step back and explain corrective structures in a bit more detail, especially since that is what we have been dealing with of late.
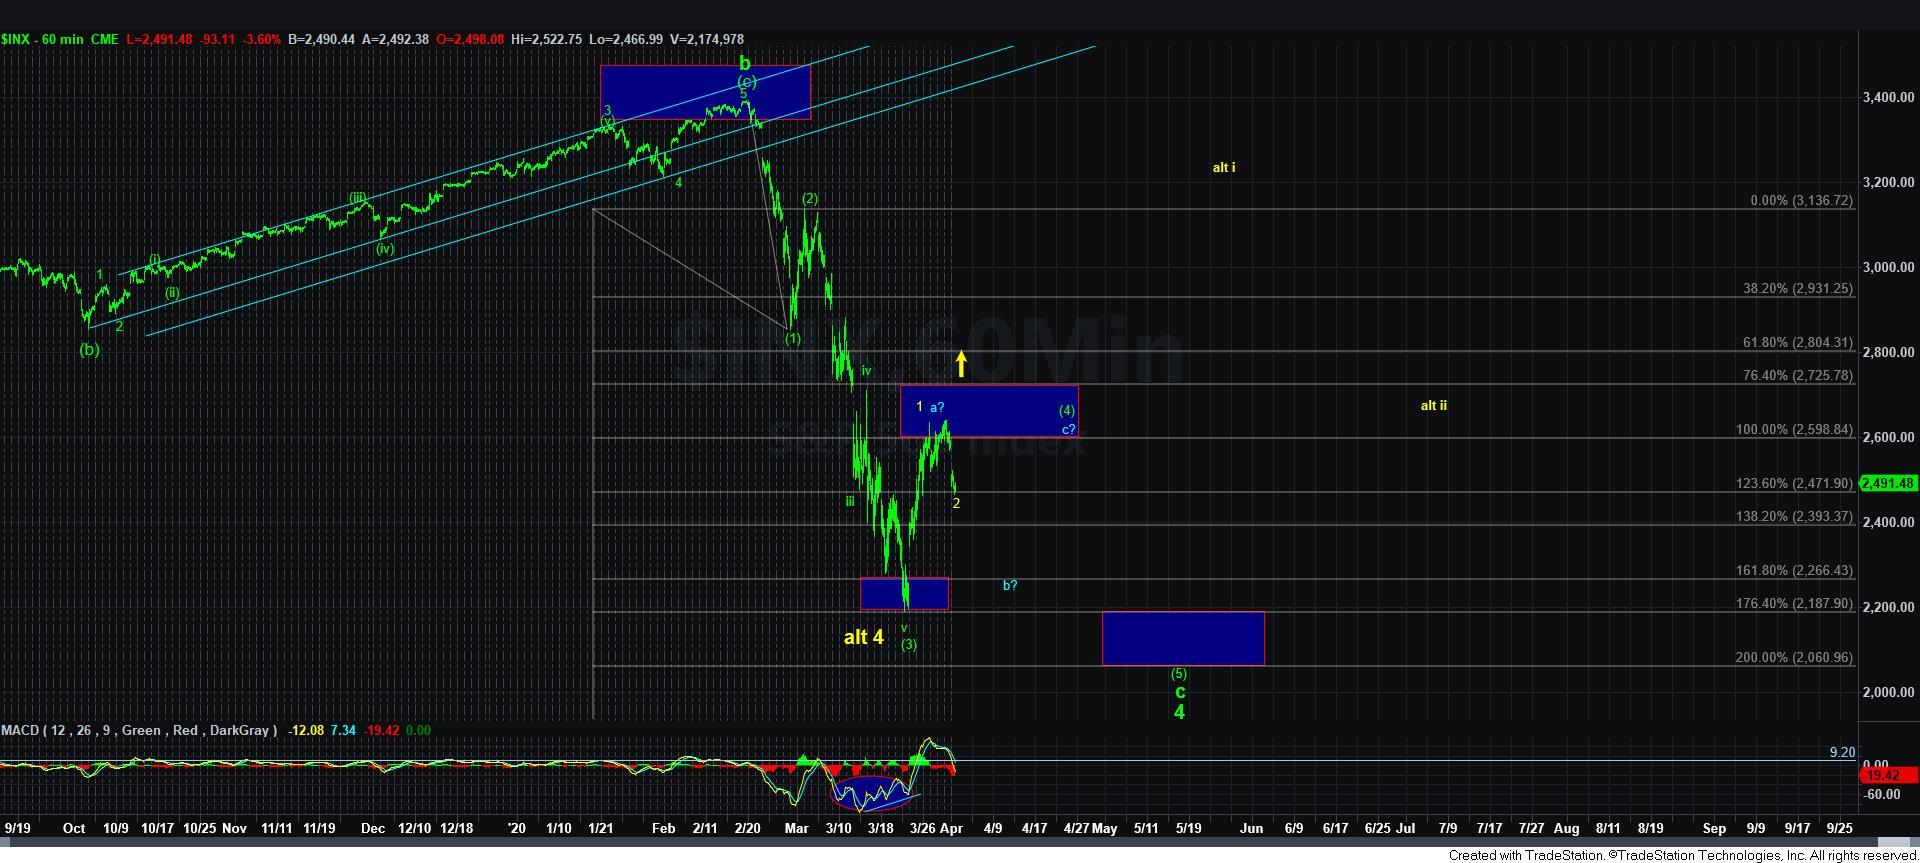
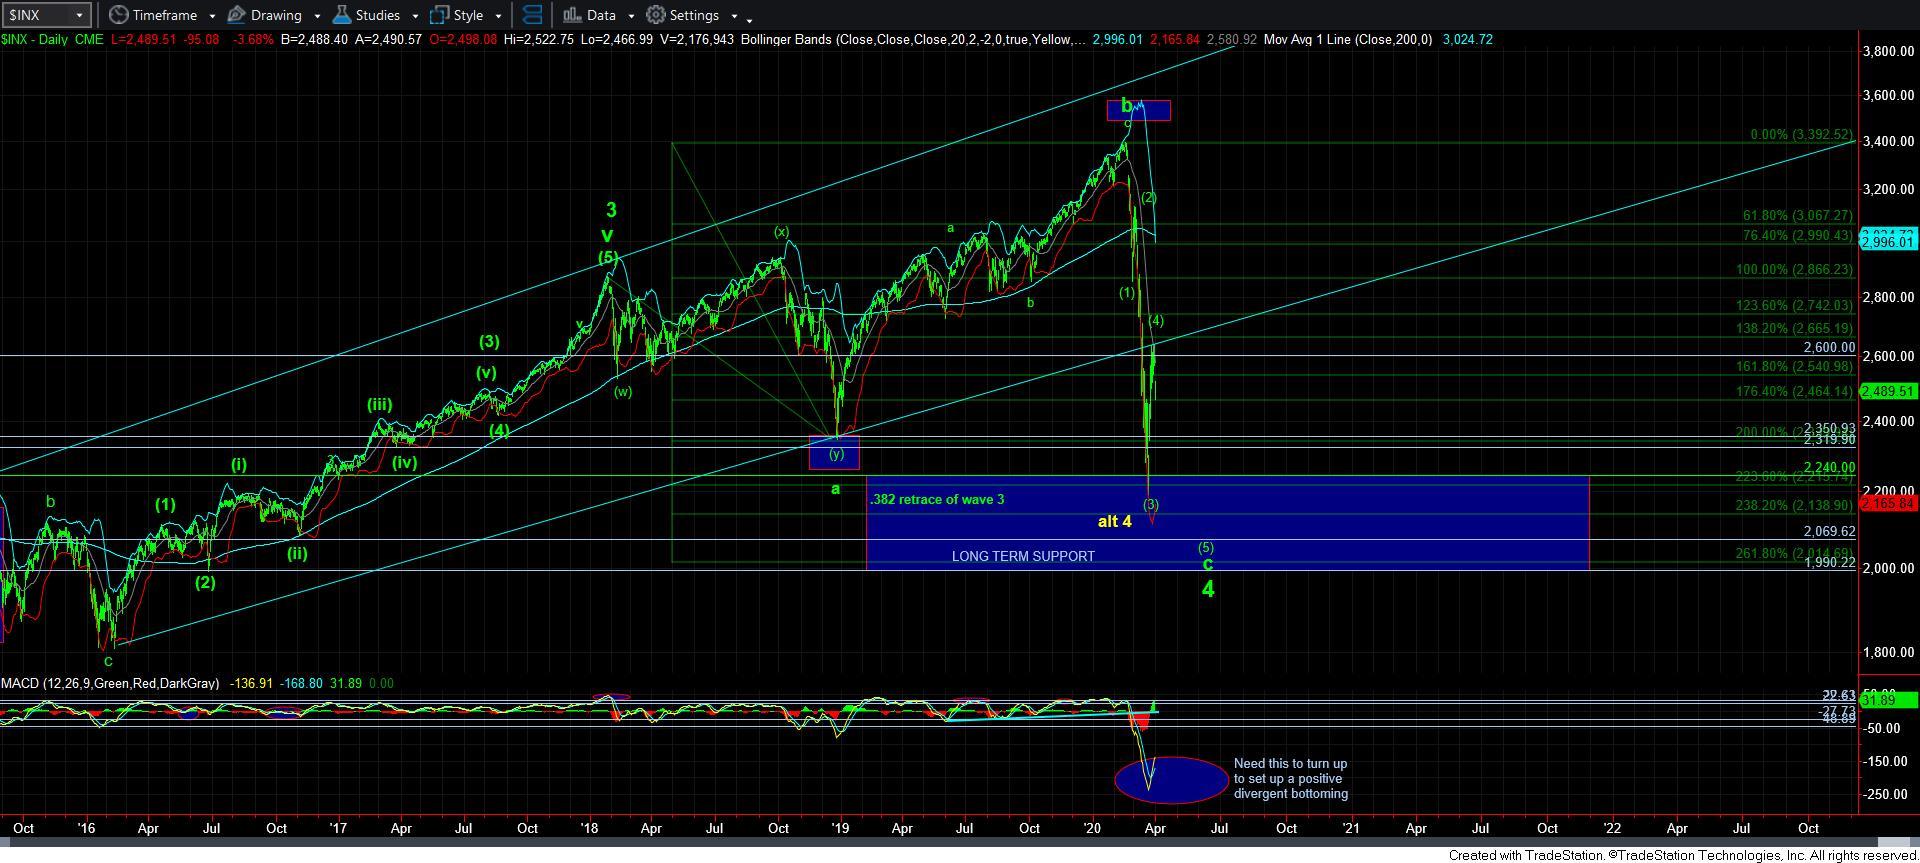
Our primary count has us in wave [4] within the c-wave of wave 4, as you can see on the larger degree charts attached. The c-wave itself is most commonly a 5-wave structure, and, as I noted, I current view us as bouncing in wave [4], which will likely be followed by a lower low in wave [5]. The alternative on the larger degree charts consider that all 5 waves have been completed to the downside, but that is not as clear as we would normally see within a 5-wave structure.
Now, within wave [4], we break it down into a 3-wave, a-b-c structure. And, most commonly, the a-wave breaks down into a 3-wave structure – labeled as [a][b][c] and the b-wave breaks down into a 3-wave structure – also labeled as [a][b][c]. Sometimes, but in the lesser instances, the a-wave is a 5-wave structure, but the c-wave is almost always a 5-wave structure, and the b-wave is always a 3-wave structure.
Also, there are common Fibonacci relationships between the a-waves and c-waves, which usually tend towards a 1.00 ratio or a 1.382 ratio.
In our current case, I view us as being in the b-wave within wave [4]. That means that the a-wave rally off the wave [3] low as has completed, and we are now in the b-wave pullback of wave [4].
At this point in the write up, I want to again note that corrective structures, especially 4th waves, are the most variable waves within the 5-wave Elliott structure. Moreover, the b-waves within the 4th waves provide the most whipsaw than any other segment within the structure, since they are always 3-wave structures. This is why I analogize attempting to identify a high probability micro path within a 4th wave or b-wave as akin to attempting to throw Jello for distance.
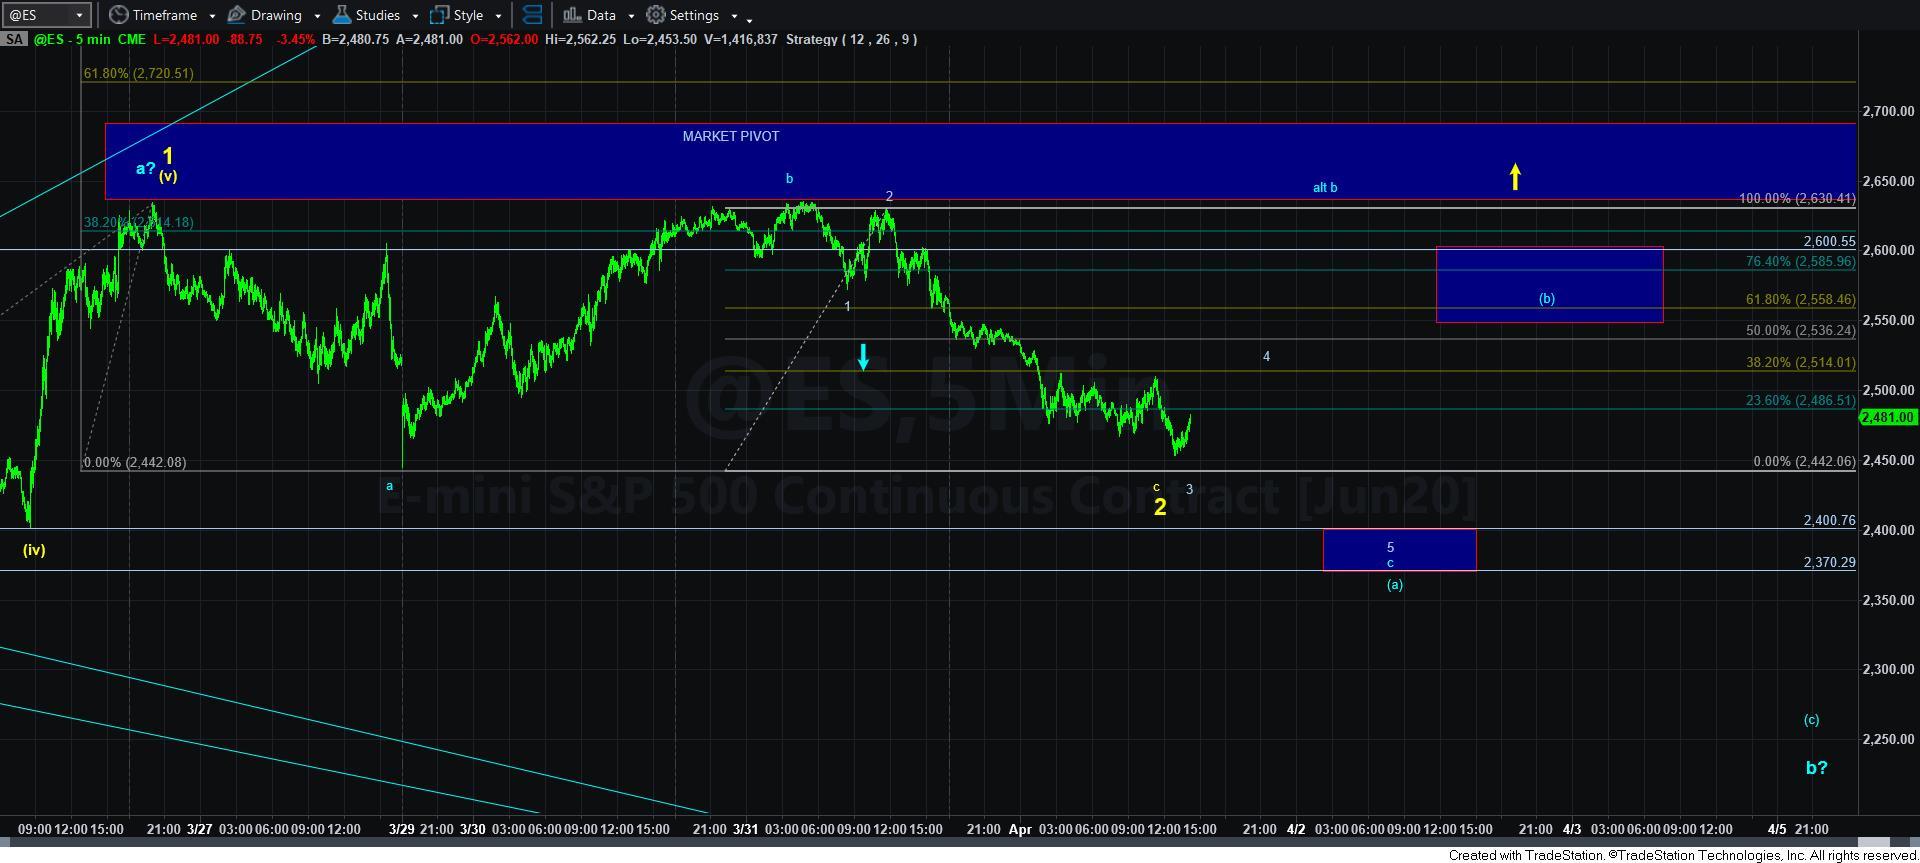
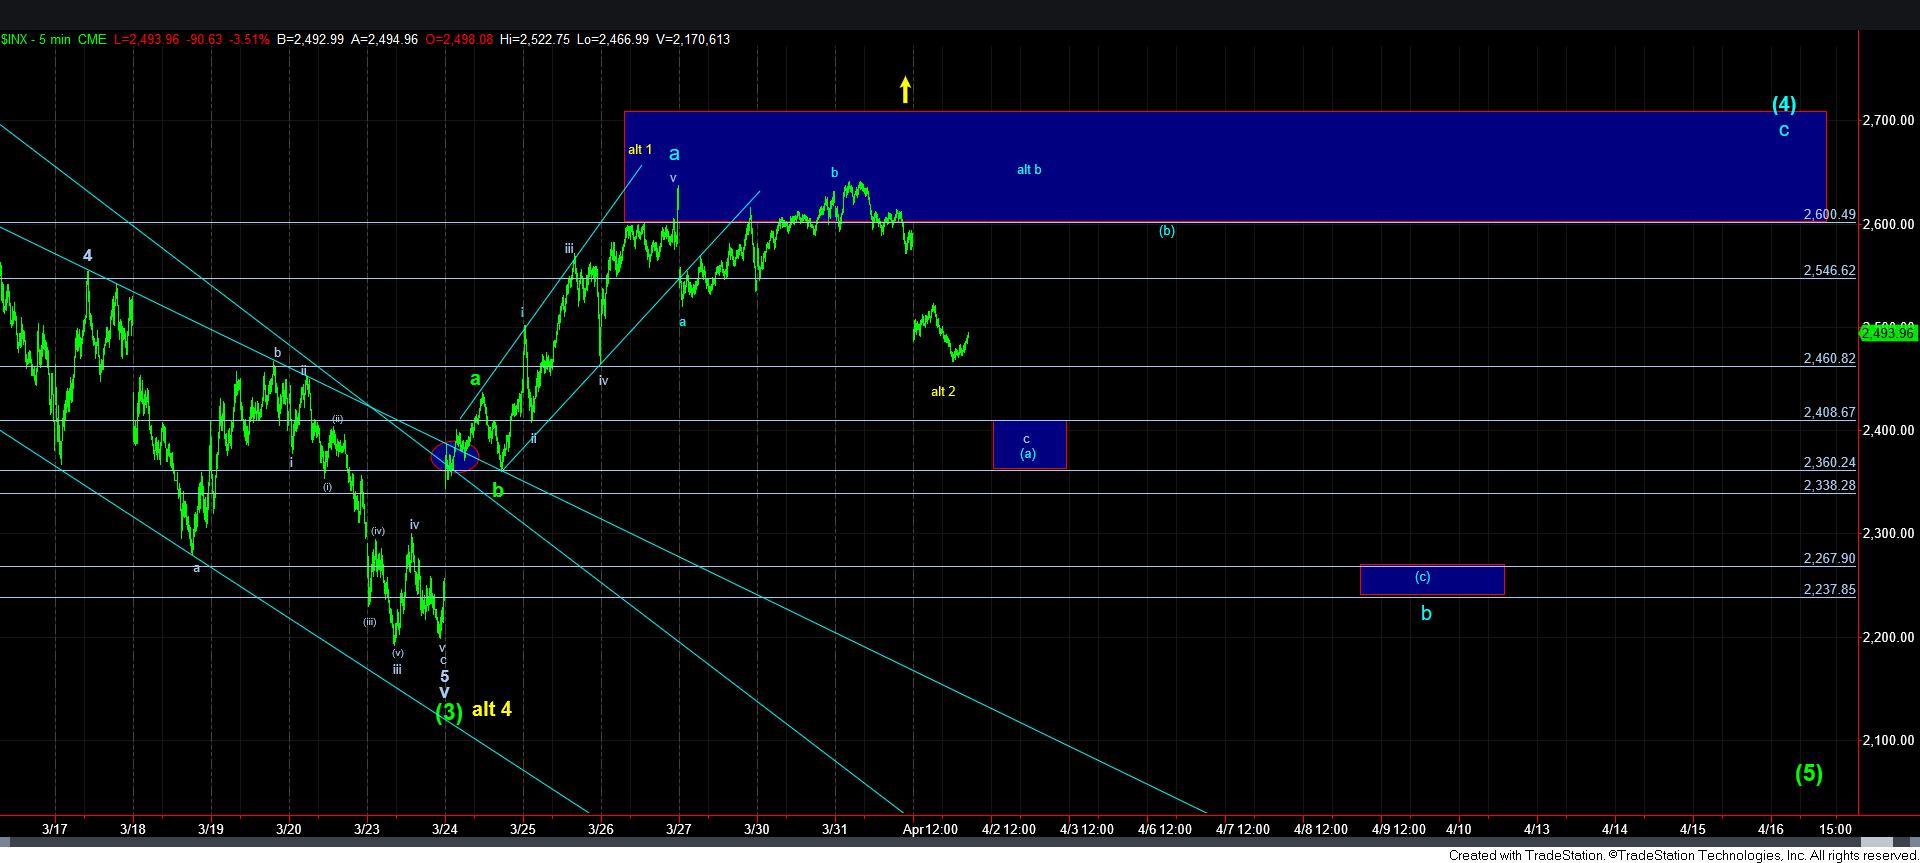
Within the b-wave of wave [4], as noted above, we need to break that structure down into an [a][b][c] structure. Currently, I view us as being within the [a] wave of that structure. Now, remember, the [a] wave also breaks down into a 3-wave structure in the most common occurrences. That is why we have been tracking the action of late with the blue a-b-c structure within the [a] wave, which you can see on the 5-mintue charts.
Now, this is where we move into the cross roads discussion I mentioned above. I have noted a number of times as we were approaching the lows in the SPX struck over a week ago that there is potential for us to have completed all of the c-wave of wave 4 at those lows. While it is not my primary count, the potential exists. And, I think we are now approaching a point in time where the market has the opportunity to prove that to be the case.
As the market has been consolidating below the market pivot box I placed on the 5-minute ES chart, the sideways consolidation we have seen over the last 4 days can easily count as a wave 2 flat pattern in the ES (which is not seen in the SPX), as shown in yellow. In fact, if we hold the 2440ES support region in this drop, then it is rather textbook. In order to prove this to be the operative structure, we will need to see an impulsive rally off this region, with us eventually breaking out over the 2725SPX region. Should that occur, then I have to give this potential much higher probability than I place in it at this time.
But, within the primary count, I don’t think we have dropped enough for this to be all of the [a] wave within the b-wave. Rather, I think we need to drop a bit lower towards the 2370-2400ES region, as shown on the 5-minute chart. Therefore, as long as the market remains below the 2520ES region, I can view us as still attempting to complete a 5-wave c-wave down in the [a] wave, as shown by the count on the ES chart.
Now, if you remember, I said that structures within b-waves can take many twists and turns as they are quite variable. Therefore, if the market does rally off the 2440ES region, and we had back up towards the 2650/60ES region, it would likely mean that either the b-wave within the [a] wave of the larger b-wave has not yet completed (as shown by the alt b on the chart), or we are about to break out in wave 3 in yellow (which would be supported by a strong move through 2660ES). This makes the 2650/60ES region very important should be unable to break down below 2440ES on this downside move.
So, in the meantime, as I write this update, I think the next few days are going to provide us with confirmation that we are still going to whipsaw around within this b-wave of wave [4], or that the markets no longer want to wait around for that lower low which many expect, and we can potentially break out through 2660ES, with follow through over 2725 opening the door to the potential that wave 5 to 4000+ has begun.
I think you now have the appropriate parameters as I see them, and the next few days will likely be quite interesting.