Last Squiggles? - Market Analysis for Jul 12th, 2023
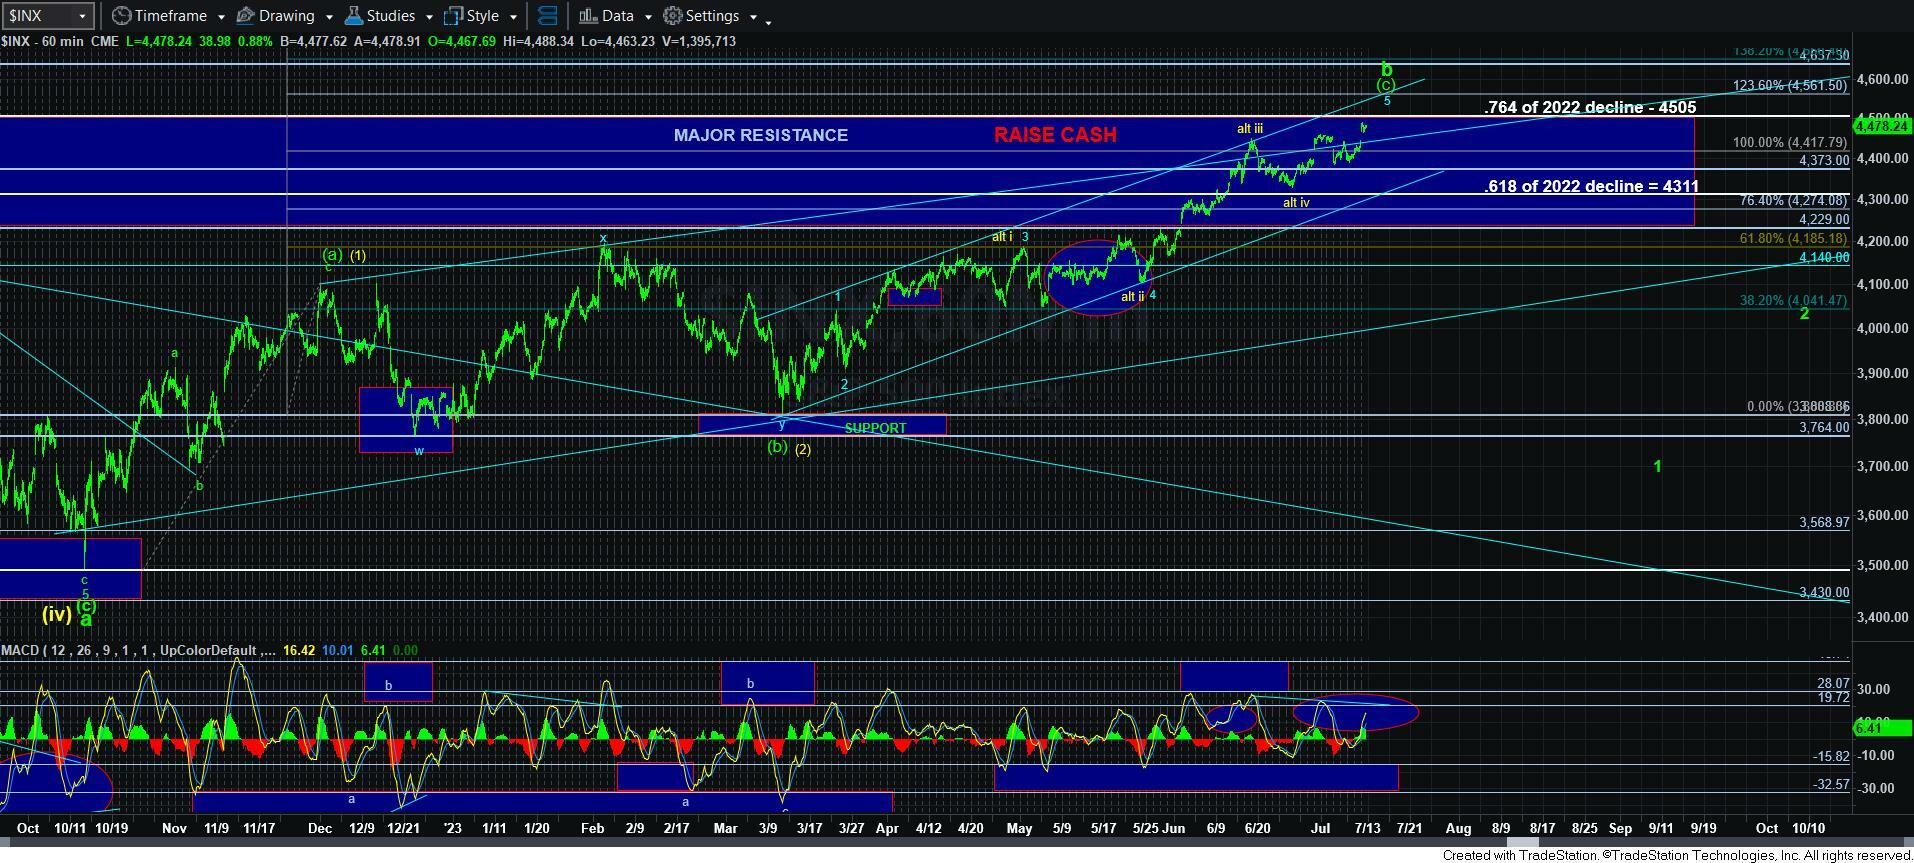
Well, the market is now exactly where we wanted to see it over this last week. We are now in the extended target box for what can be a b-wave high, as we approach the 4505SPX region, which represents the .764 retracement of the 2022 decline. We were alerted to this potential when the market pulled back quite correctively from the 4448SPX high struck in mid-June.
So, the question now is if the market wants to top here and begin a decline to 3000 or a bit lower? Well, right now, that remains the primary count, and has been the primary count for many months. Yet, as you know, I am not one to stand on ceremony, nor will I remain in a wrong position when the market tells me clearly that it is wrong. So, what do we need to see to keep this count as our primary count?
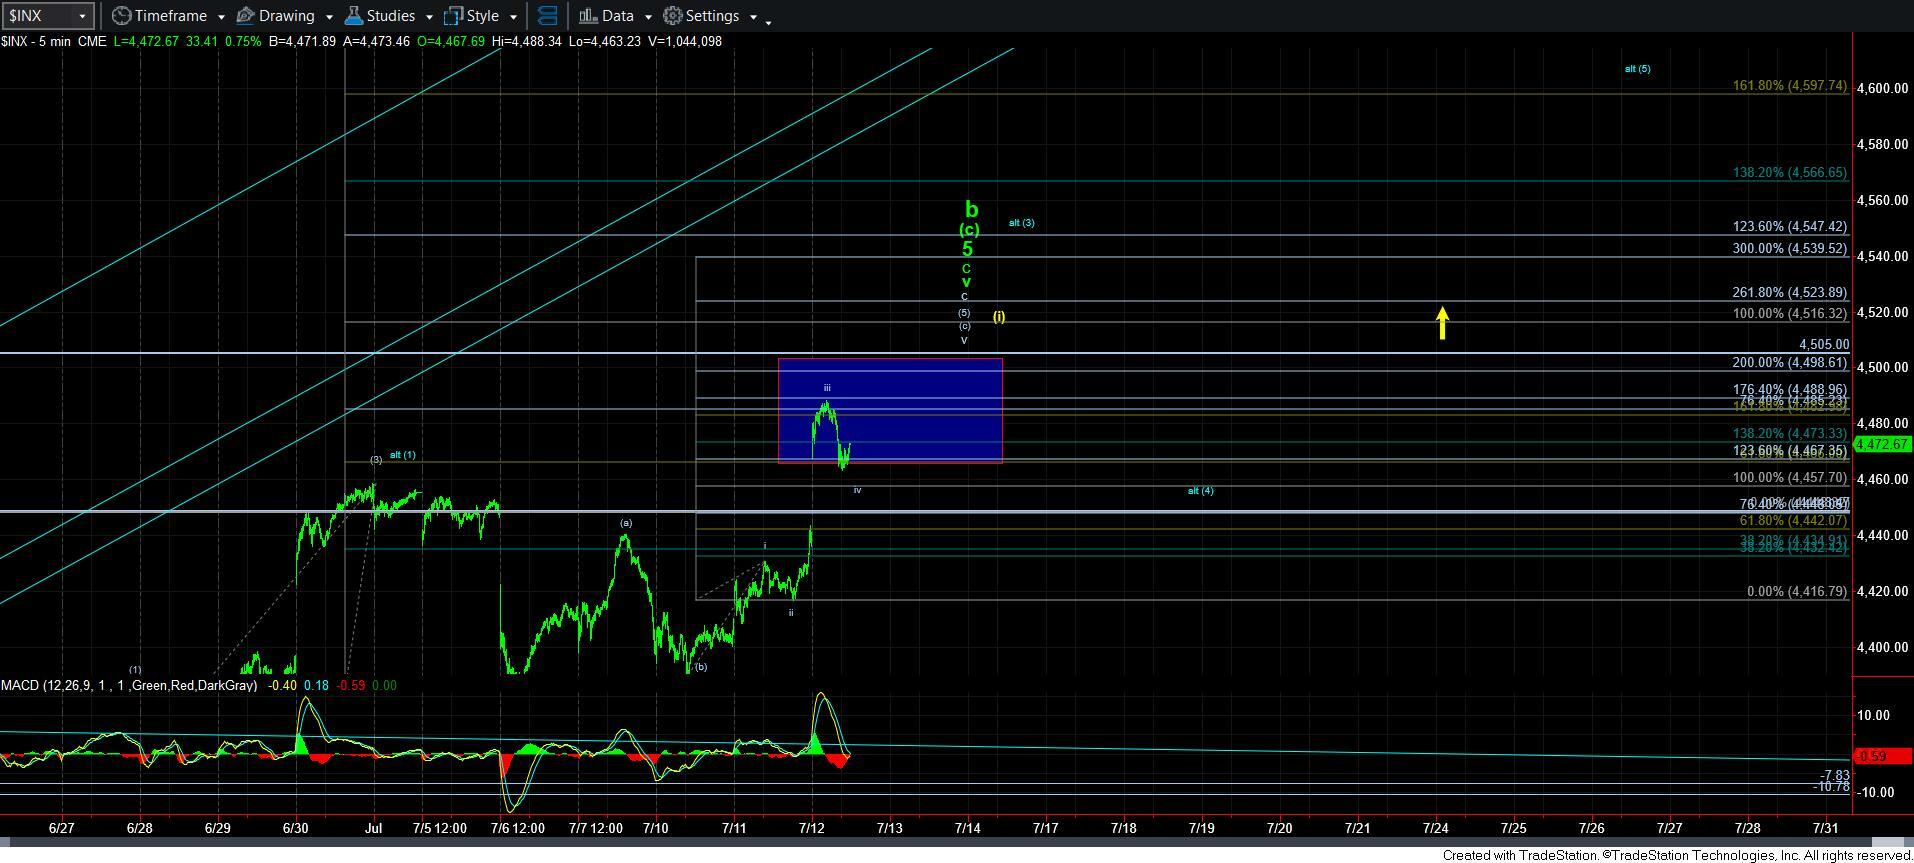
When we look at the 5-minute chart, you will see that we are likely in wave iv-v in what can be the final 5th wave to complete this nine month rally off the 3500SPX low that we caught. The micro support is the 4457SPX region, which is the 1.00 extension within the [c] of [5], as you can see from the 5-minute SPX chart. And, you see it can potentially culminate this 9 month b-wave rally.
Of course, we need to remain below 4516SPX, as I outlined earlier today. But, I would doubt we would break out over 4505SPX if this count is truly coming to completion.
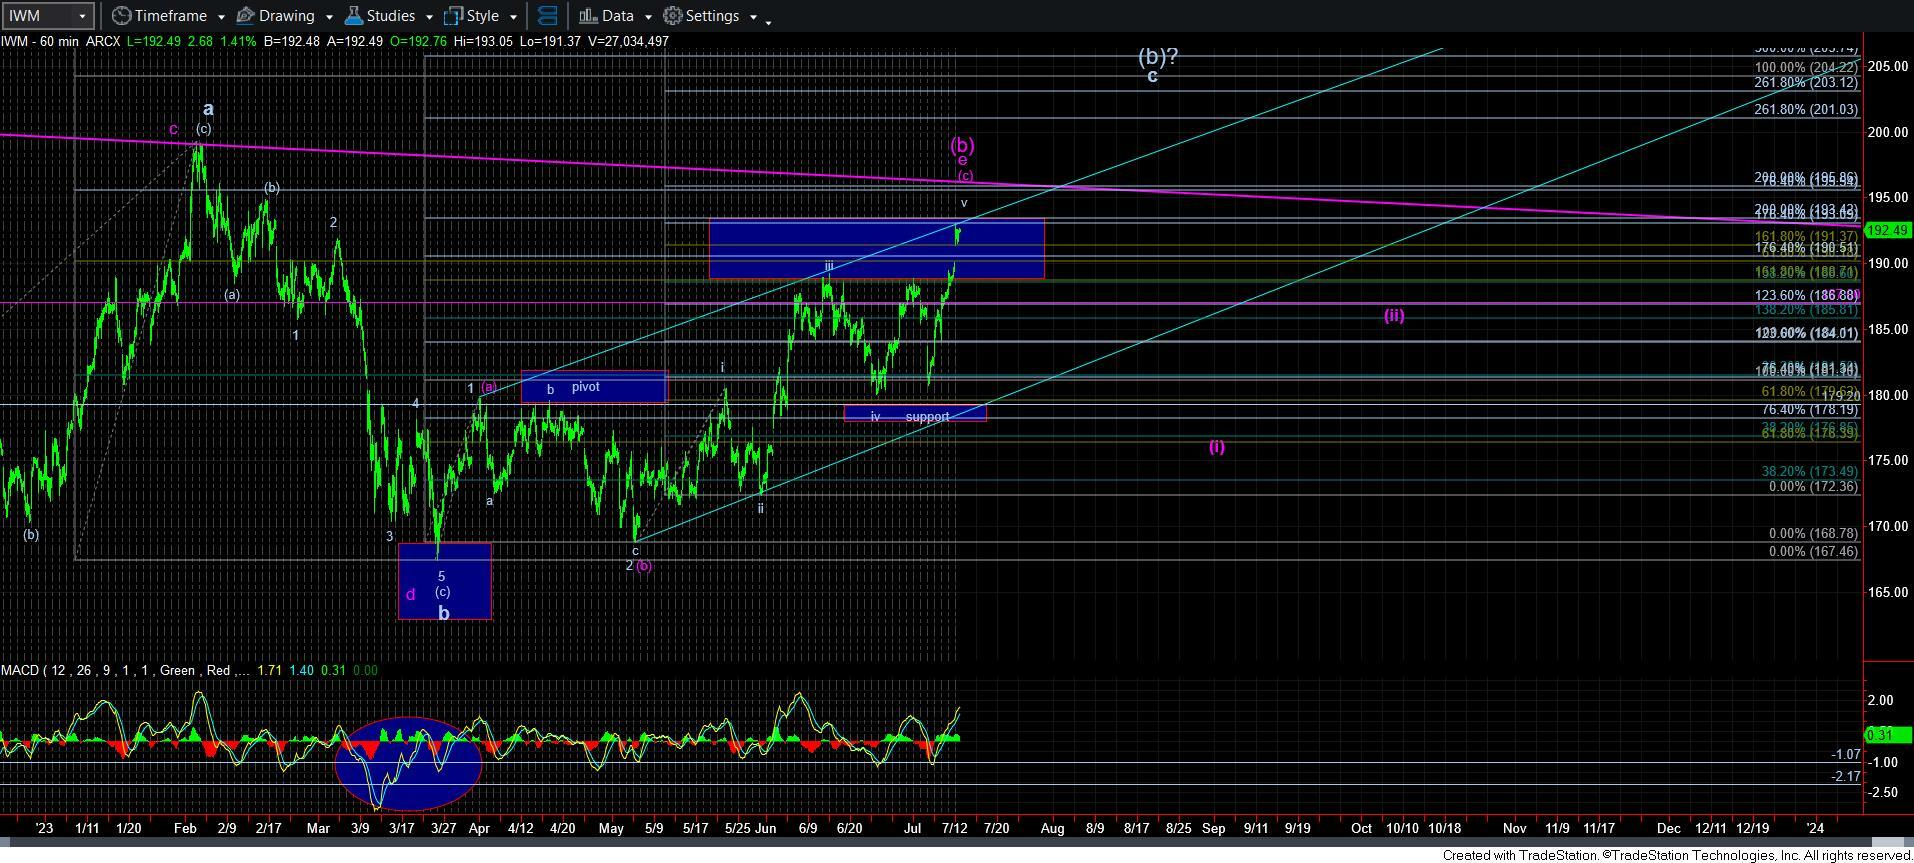
The IWM is also coinciding with this potential. As you may remember, we identified a potential [b] wave triangle in IWM, which suggested we would rally up to the target box, within which we are now striking the top, from the bottoming box we outlined back in March. Moreover, we are striking the Fibonacci extension which would represent a topping target in the 193.50 region. Of course, this can still attempt to extend closer to the downtrend channel for the e-wave of the triangle in the 196 region. But, the pattern finally seems rather complete at this time, with the potential for another squiggle or two to complete this wave v, which pretty much mirrors the SPX potential.
So, what do we need to see to begin confirmation that a major top may be in place, or that we are setting up to rally much higher?
Well, clearly, I would want to see a high struck between 4490-4505SPX. I would then want to see a break down below 4457SPX to provide us with an initial micro indication that a top has indeed been struck. We will then have to carefully analyze the structure of that decline. If that structure is clearly impulsive, then we have an initial indication that we have potentially caught the early beginnings of a rather large c-wave decline. However, if that drop is clearly corrective in nature, then we have to begin considerations of the next rally which can point us up to the 4800SPX region in the coming months.
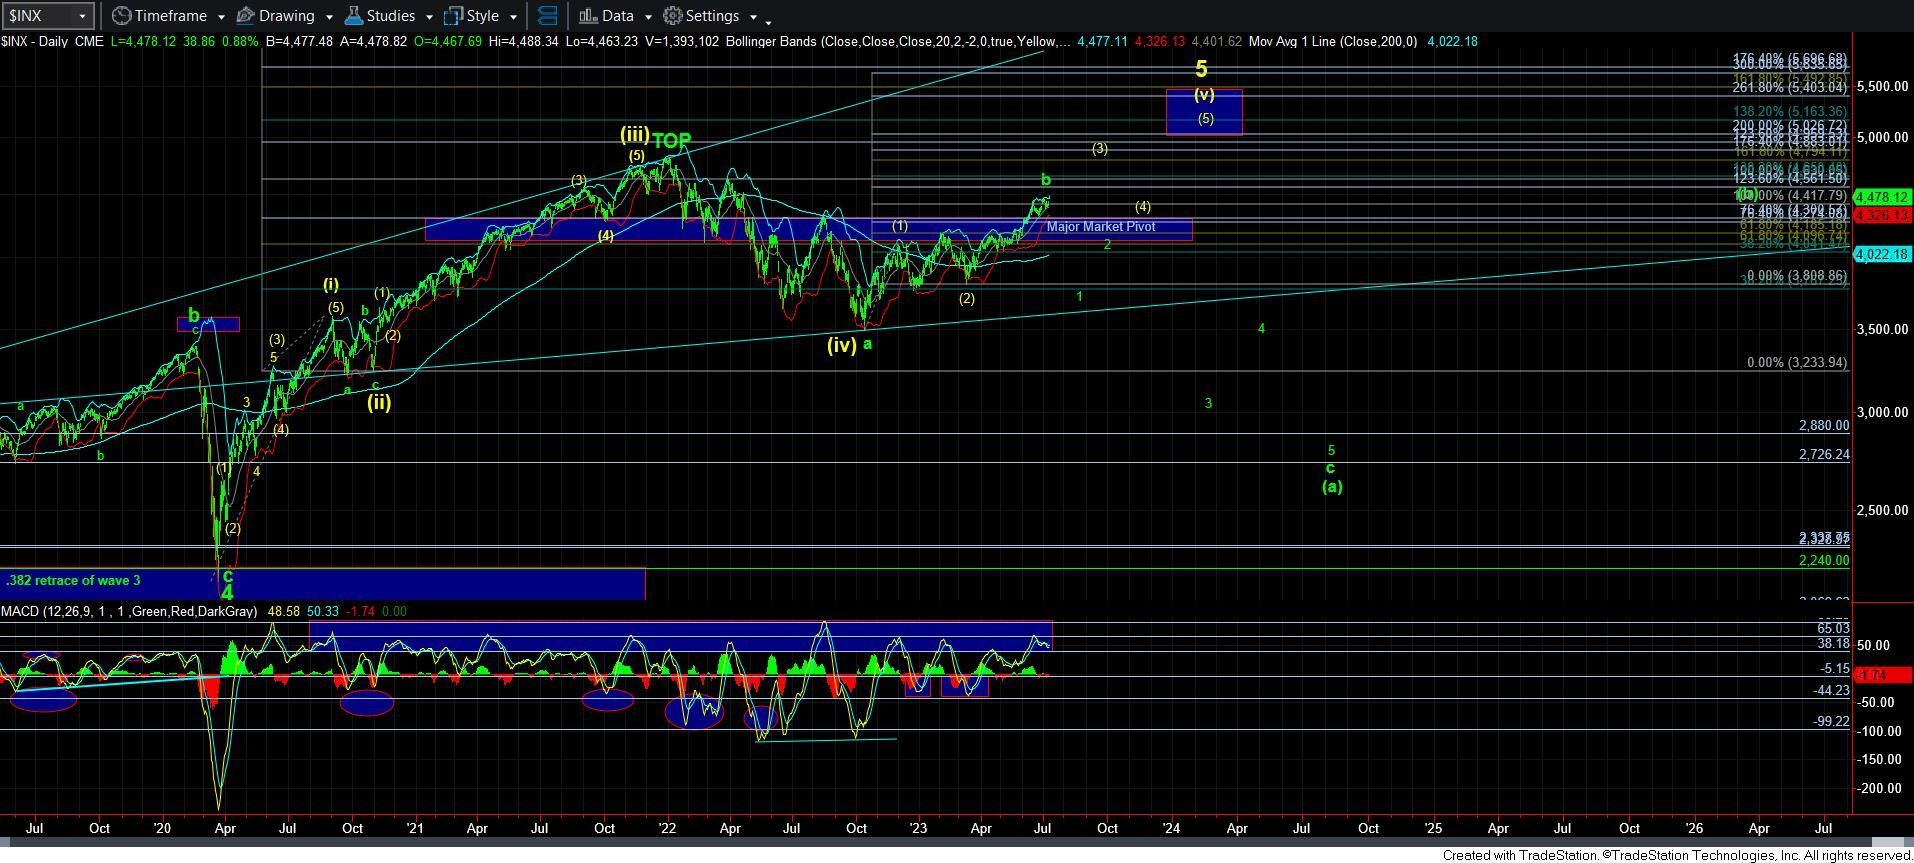
In the meantime, not only is the structure in SPX and IWM suggesting caution, the MACD on the daily chart has certainly been displaying negative divergences through this rally off the October 2022 low, as well as a micro-divergence up here. Of course, that divergence can still evidence the potential for a wave v of [3], as presented in yellow. But, I have to admit that the structure of the MACD is not truly indicative of this being a wave [3] off the October low. The structure is much more indicative of a corrective b-wave rally.
That being said, these are simply clues as to our determination. Final determination will clearly be driven by price action and how the market handles support and resistance. There is nothing more important in my analysis.
In conclusion, as long as the market holds over 4457SPX, I am expecting a push up to the 4490-4505SPX region. As long as that holds as resistance, and begin a turn down below 4457SPX, then the structure of that decline will be our next major clue as to the next larger degree move in the market. I am going to be listening quite intently to these messages over the coming week or two.
In the meantime, as I highlighted earlier, our upper resistance for the immediate topping is 4516SPX. Should we break out through that directly, then I have to assume the more protracted diagonal pointing to 4600SPX region, which I outlined earlier. For now, that is not my expectation, but I have to objectively know where I am wrong in my primary expectation.