Last Chance For 3225 On SPX
Well, as I see it, we now have one last chance for the S&P 500 (SPX) to strike our long-term ideal target at 3225. In fact, there is a rather perfect set up that can take us there, which I outlined last week. But, a failure of this setup over the next few weeks will likely be very telling.
Currently, the 2956-78 resistance region is now standing in the way of the rally to 3225 on the SPX. And, should we fail in the current set up to break out through that region, then the probabilities will significantly increase that this 5th wave to complete wave 3 off the 2009 lows will complete with the ending diagonal pattern that our analyst Garrett Patten has been primarily tracking.
Moreover, the current structure has now provided us with very clear signal lines of demarcation to know if 3225 is in the cards or not. So, should the SPX bottom at 2880 or higher, and then rally to at least 2956, 2930 will then be the KEY line of demarcation to me. Should we strike at least 2956 and then break back below 2930, this will give me a much higher probability expectation that 3225 may be years away rather than months away.
So, let’s review where we are step by step:
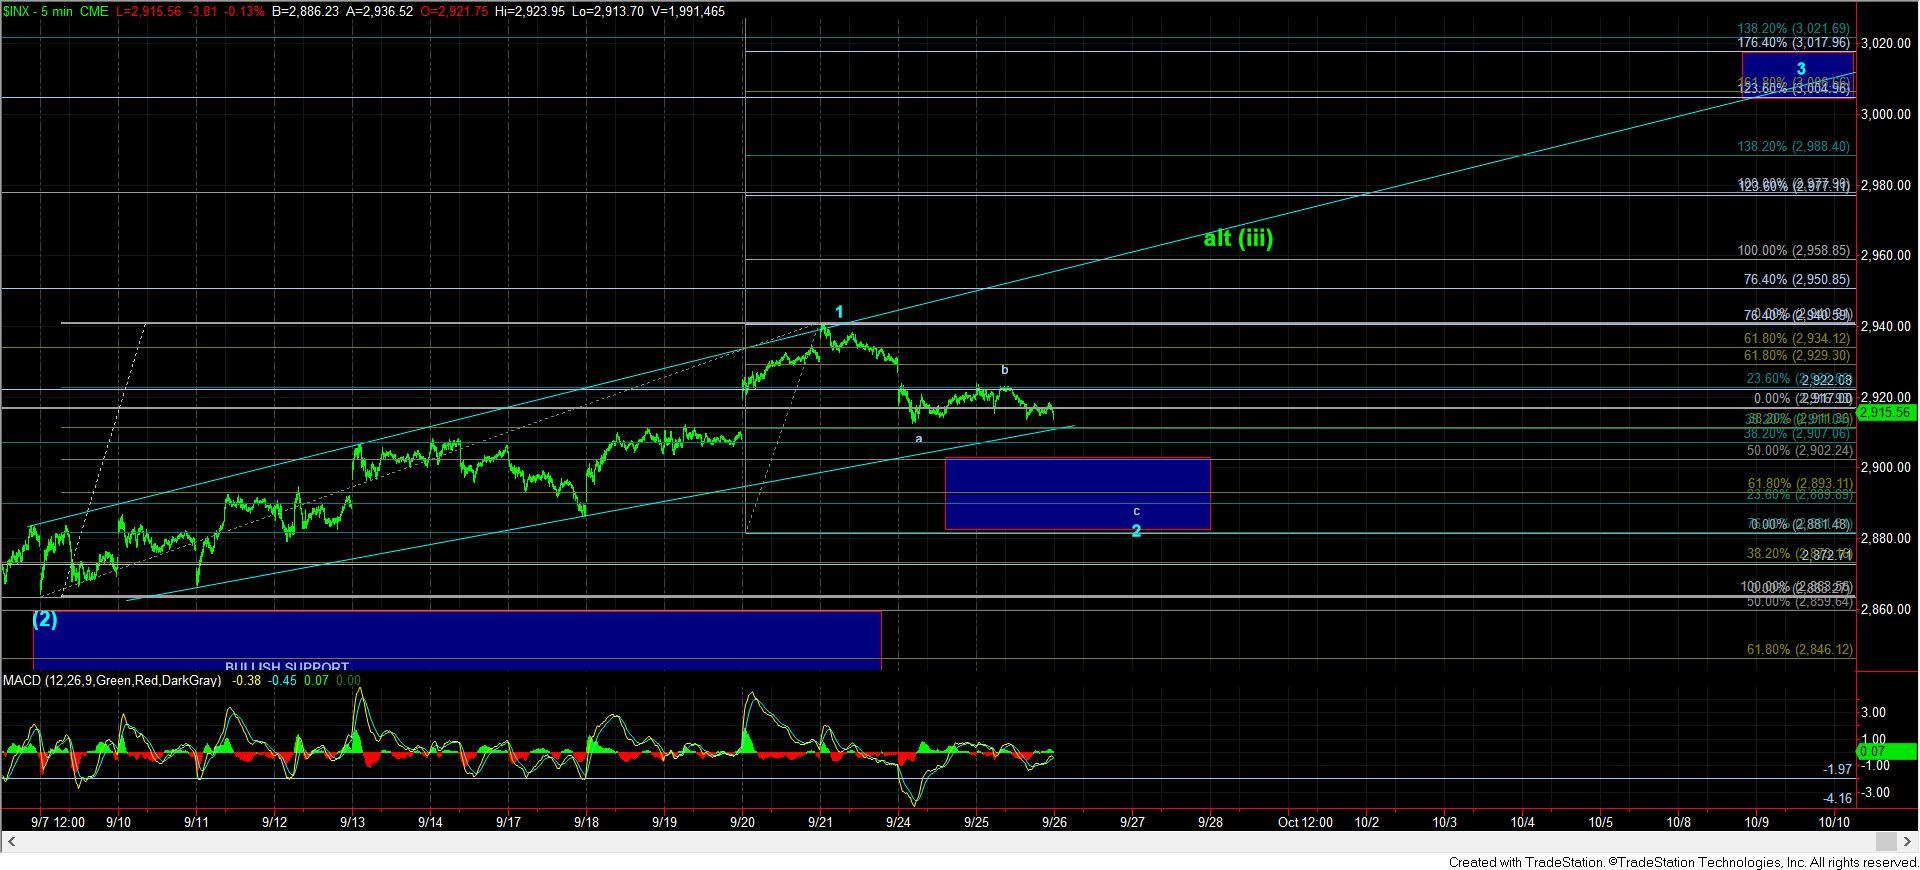
With the market breaking 2922 on the SPX, it made it rather clear that the inability of the sub-structure to appropriately line up within the larger degree structure was cluing us in to the fact that the immediate rally was not sustainable. But, until we broke 2922, I had to respect the bull market as it certainly has earned that over the last number of years. I tried explaining this last week in threads and updates in our trading room, as well as within the weekend analysis:
“But, the issue I have with it is that the sub-structure does not line up well within the larger degree wave structure pointing to 3225SPX, and would require sizeable extensions to strike the ideal target (3000 region) for this degree wave 3. Even striking the minimum target for wave 3 of this degree at 2980SPX would also require larger than standard extensions. Yet, despite these concerns, I have to respect the bull market as long we remain over 2922SPX and give this pattern primacy.
However, should we break down below 2920SPX early in the coming week, it opens the door to the yellow alternative which would make much more sense to me from a substructure standpoint. In fact, if we pullback in this wave count to the 2880SPX level, we have a perfect alignment within the substructure pointing to 3005SPX, which fits the larger degrees we are tracking to 3225SPX quite nicely. Specifically, a 1-2 structure as presented in yellow (with wave 2 bottoming at 2880SPX) points us directly to the 1.236 extension (3005) of the wave structure one degree higher with a 1.618 extension of yellow waves 1 and 2. This would provide us with picture perfect alignment and set us up for the continued rally to 3225SPX.
This means that 2880SPX is now the perfect level of lower support for this bull market move, should we drop lower. Any break down below 2880SPX at this point would be a strong warning to the bullish side of the market.”
In fact, I even explained in my last Elliot Wave introduction article why it is key to have sub-structures align within the larger degree structures:
“But, the internal wave structure within an Elliott Wave analysis must display relationships based upon Phi in order to be able to appropriately predict the next move within a market with any form of accuracy.”
When the internal wave structure does not line up to the same Fibonacci Pinball targets within the larger degree structure, oftentimes it is an early warning sign that something is awry. This is what I was trying to warn about as we were heading into the weekend, especially when I wrote an update right before I left for the holiday:
“I simply cannot get it out of my mind how perfect a drop to 2880SPX would be to perfect the path to 3225, with wave 3 of (3) pointing EXACTLY to 3005, which would fit TWO wave degrees perfectly.”
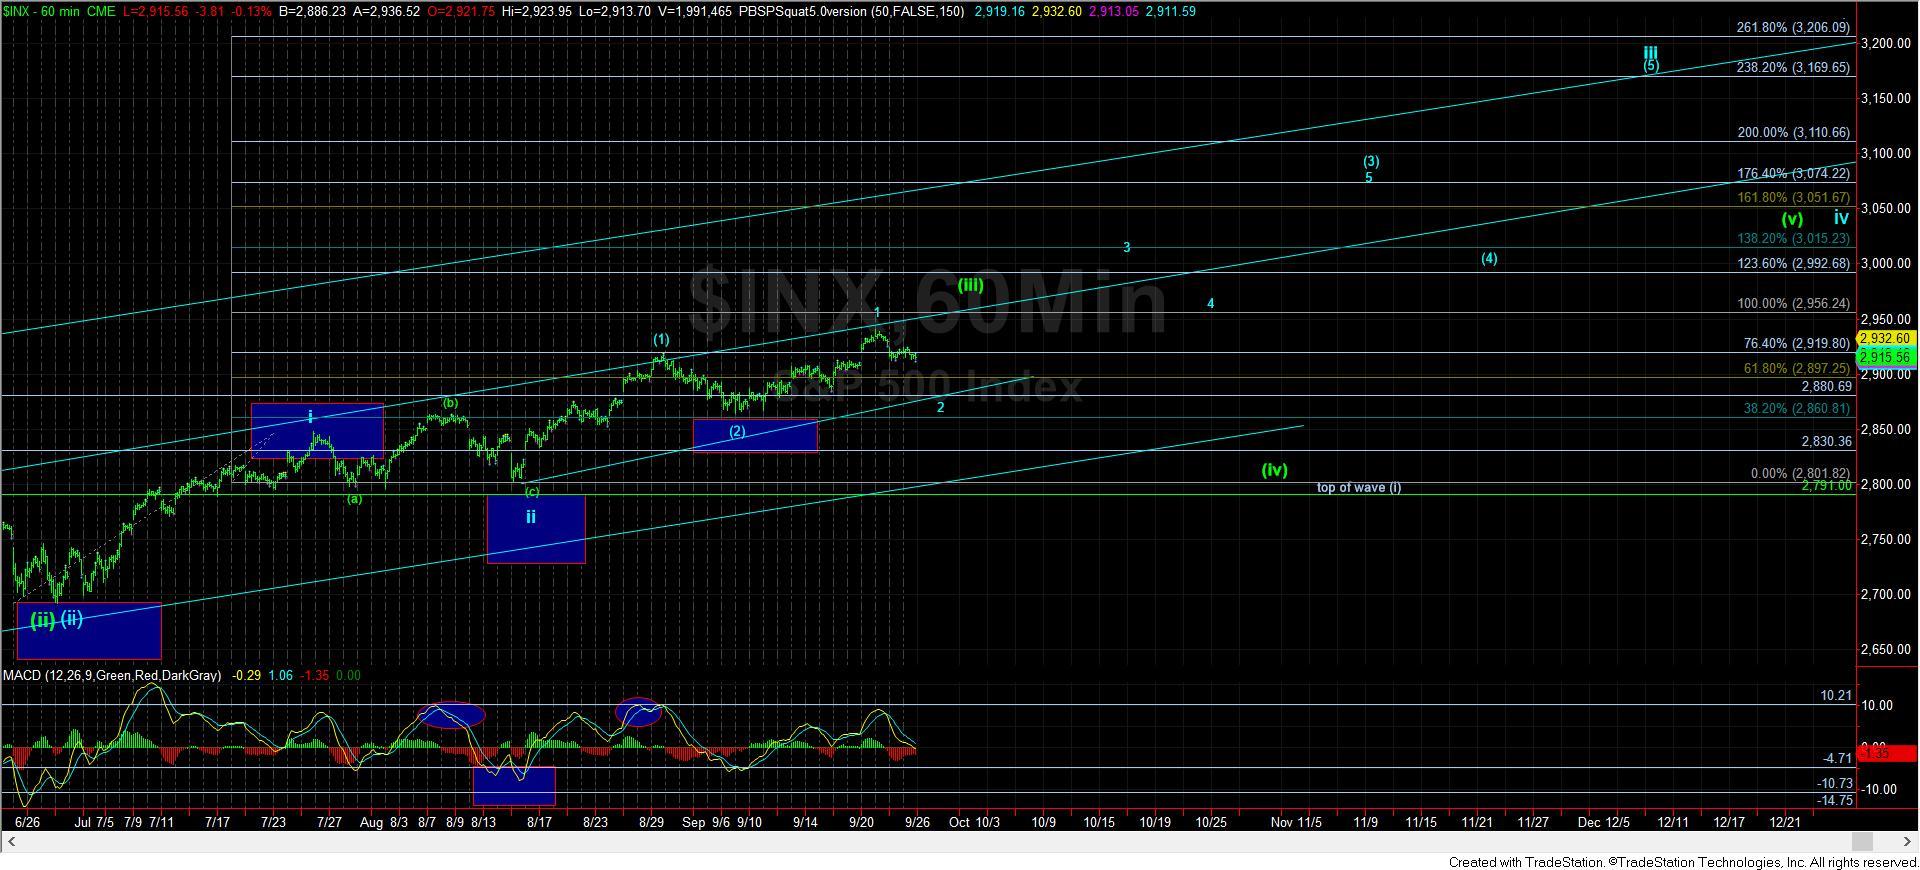
To explain this in a bit more depth, wave 3 of (3) normally targets the 1.236 extension of waves (1) and (2) (especially when wave (1) strikes the .764 extension of the prior i-ii projections). That 1.236 extension of waves (1) and (2) is the 3005 SPX region. And, should wave 2 of (3) bottom in the 2880 region, then wave 3 of (3) would target the 1.618 extension of waves 1 and 2, which perfectly coincides with the standard target for wave 3 of (3) at the 1.236 extension of waves (1) and (2) – all pointing to 3005. This is the type of confluence between multiple degrees of Fibonacci Pinball structures that provide a high probability support level and target.
So, with the break down below 2922 early this week, we now have a shot at approaching the 2880 region for a decent wave 2 within wave (3) of iii of (iii), as presented on the 60-minute chart. And, as long as that level holds as support, this is the last 2nd wave pullback that should fill in this pattern before the heart of a 3rd wave points us up towards the 3170 region to complete wave (iii) off the April lows within the next several months (as shown on the 60-minute chart).
In fact, I can no longer accept any further 2nd waves, as the pattern is now almost full, and has no more room for any more machinations. Therefore, the market has to react perfectly from this point forth in order to maintain a pattern pointing to 3225 on the SPX. Any slip up in this structure from this point forth, and I will be moving into the ending diagonal green count.
That being the case, there are several ways this more bullish pattern can fail, and place us strongly within the ending diagonal scenario I have been tracking in the background as my alternative to complete this 3rd wave off the 2009 lows.
First, should we break below 2880 on the SPX, that begins to suggest that we are in green wave (iv), and green wave (iii) of the ending diagonal has completed. Support for green wave (iv) is between 2800-2830, but I would have to allow a drop as deep as the 2775 region, which would provide the overlap we normally see in a 4th wave of an ending diagonal.
Second, should we hold 2880 and fail to break out through 2956-78 and then break back down below 2930, that would also signal that green wave (iii) in the ending diagonal has completed, and wave (iv) has begun.
At the end of the day, we are left with one uber bullish path left, and there is there is no more room for error. For this to point us to 3225, we must hold 2880. We must then rally through 2980 without breaking back below 2930 on the SPX. Should we be able to thread that needle, then the probabilities remain on the side of 3225 being our target in 2019. And, any failure within this pattern places us clearly in the ending diagonal pattern, which will likely complete at the end of 2018 or early 2019, and kick off the start of the 30% correction we are expecting with a strong reversal targeting the 2500-2600 SPX region for just the a-wave of wave 4 off the 2009 lows.