Large Wave 2 - Market Analysis for Sep 28th, 2016
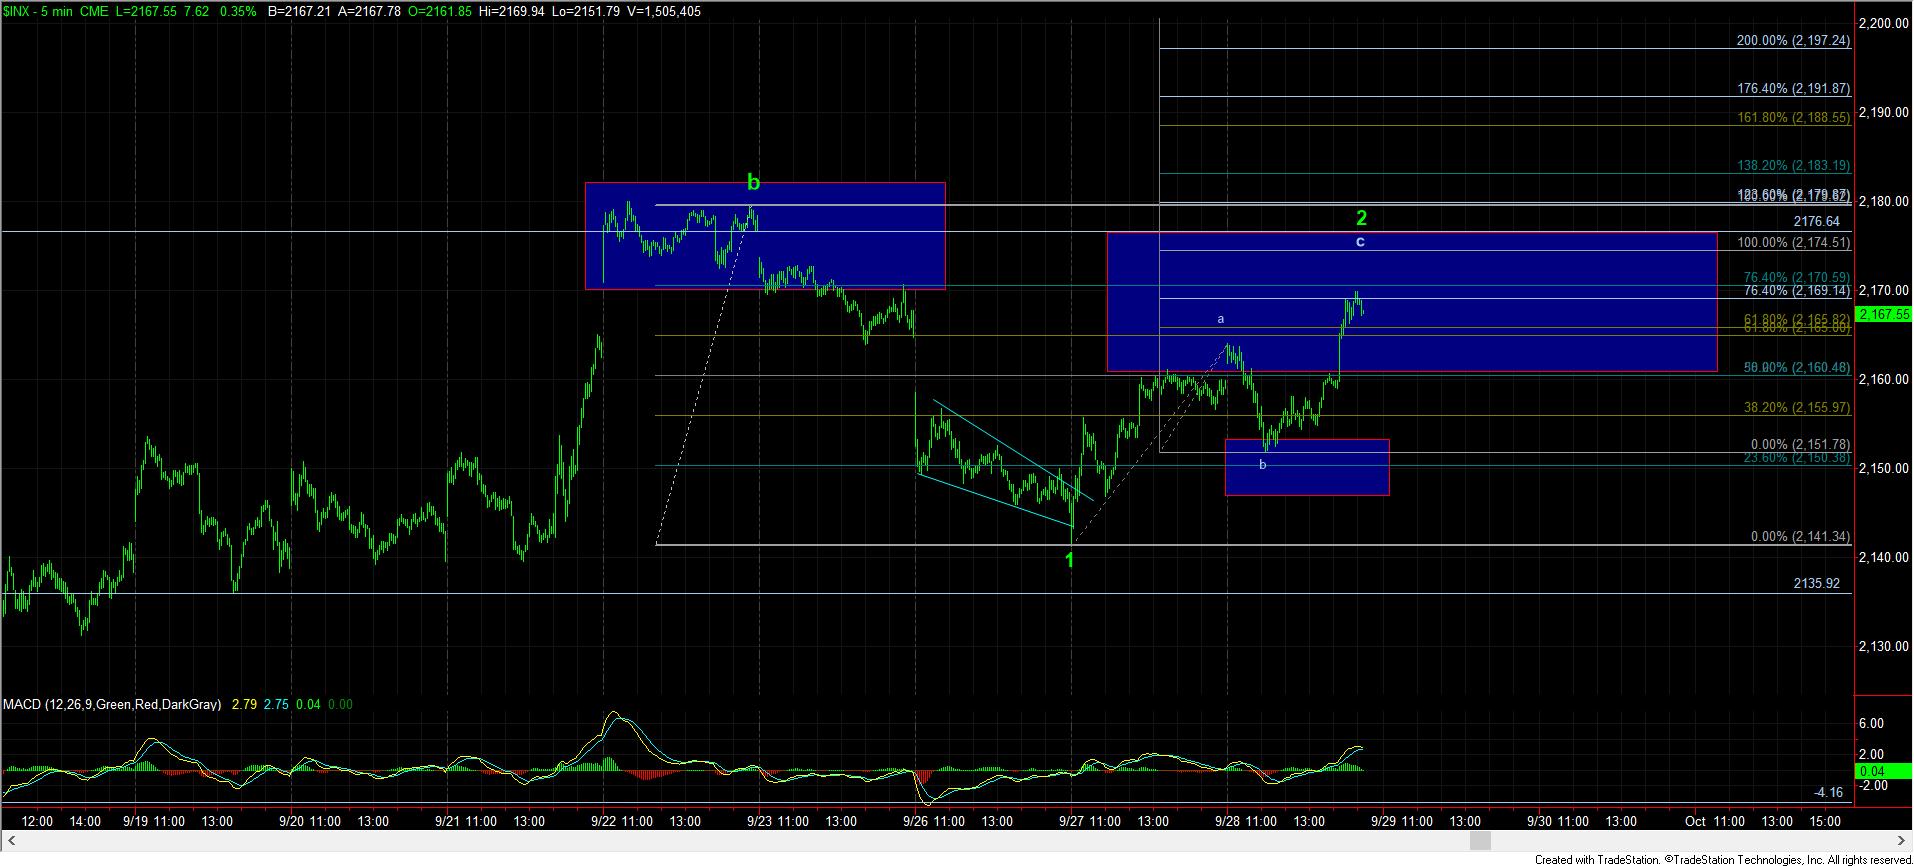
With the market only dropping in a 3 wave pullback today, it gave us some clues of the potential for the deeper wave 2 I had ideally wanted to see between the 2170-2177SPX region.
Currently, the a=c target for the move up seems to be targeting the 2175SPX level, which is within my ideal target region for this deep wave 2. As long as we remain below the high made last week at 2180SPX, this would be a set up for the market to drop down in a 3rd wave to complete the c-wave of wave ii down into our target box.
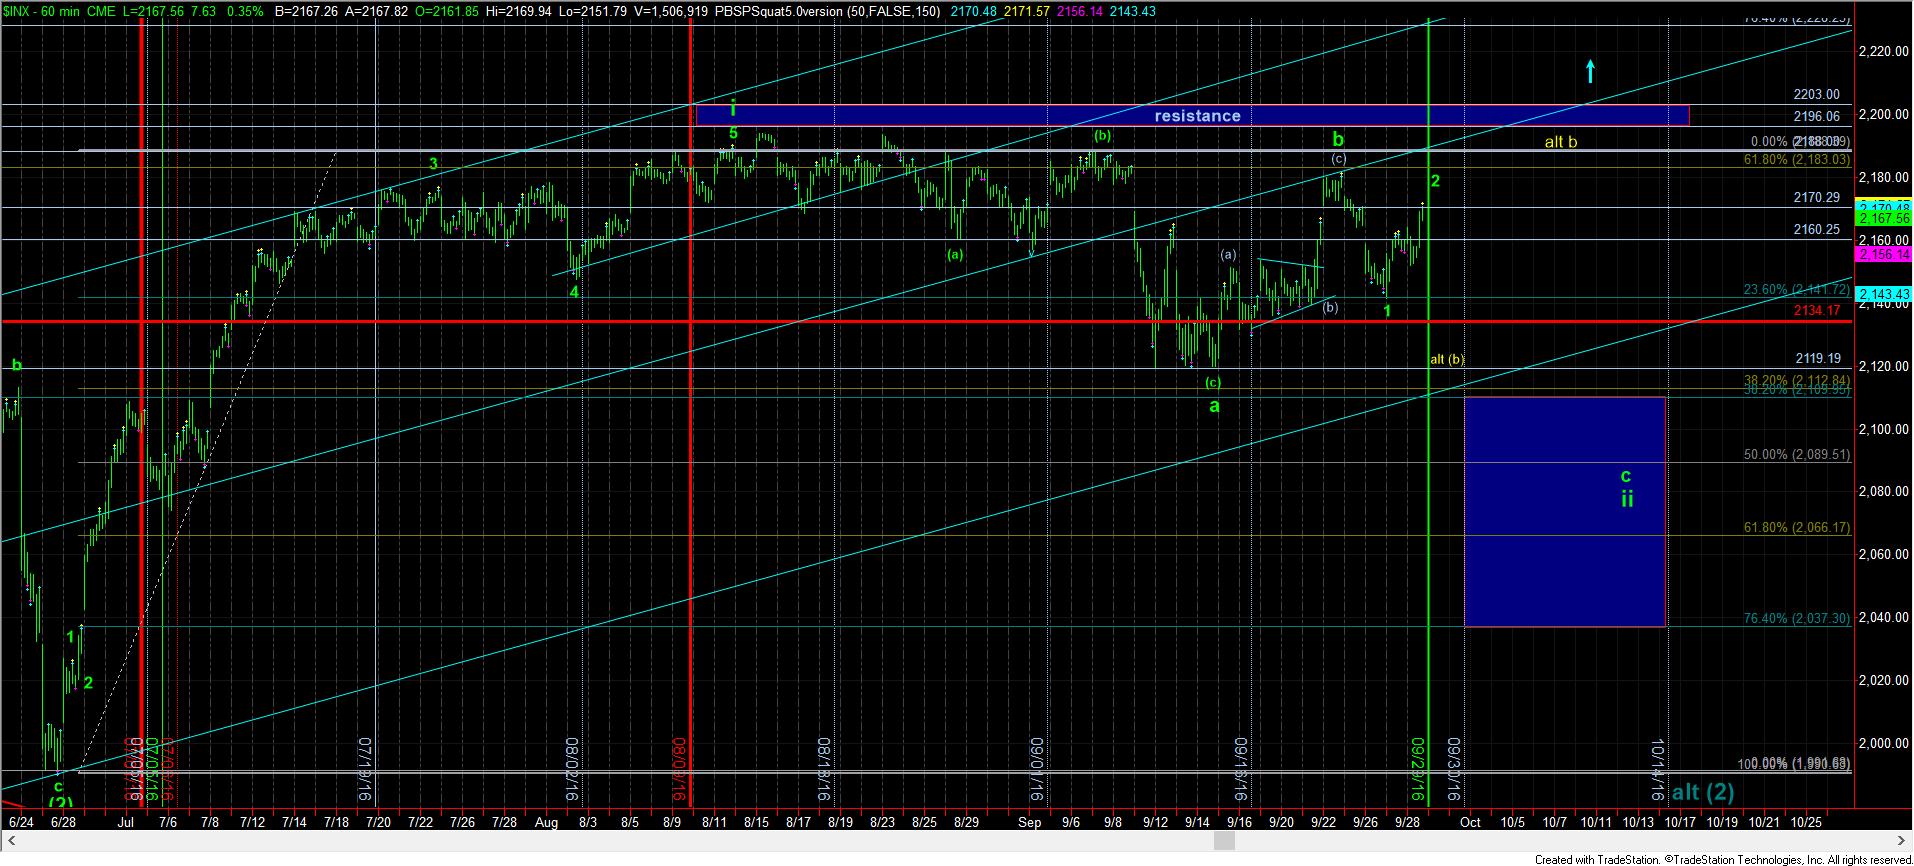
However, if the market is able to exceed the 2180SPX region, it opens the door to a much more complex b-wave topping pattern. While there is a small chance that the wave ii has already completed at the lows struck a few weeks ago, I believe it is a low probability since the move up since that time is not at all resembling the impulsive structure we should be seeing if that were the case. This keeps me focused on looking lower for the resolution of the c-wave down, at least until the market is able to exceed the 2203SPX region.
Lastly, I do want to note that today is a Bradley turn date. And, the last turn date was back at the start of August, and within 2 days of when I have wave 5 of i completing before we started this correction, as you can see from the red vertical line on my 60 minute chart.