Lack Of Downside Follow Through Opens A Bullish Door
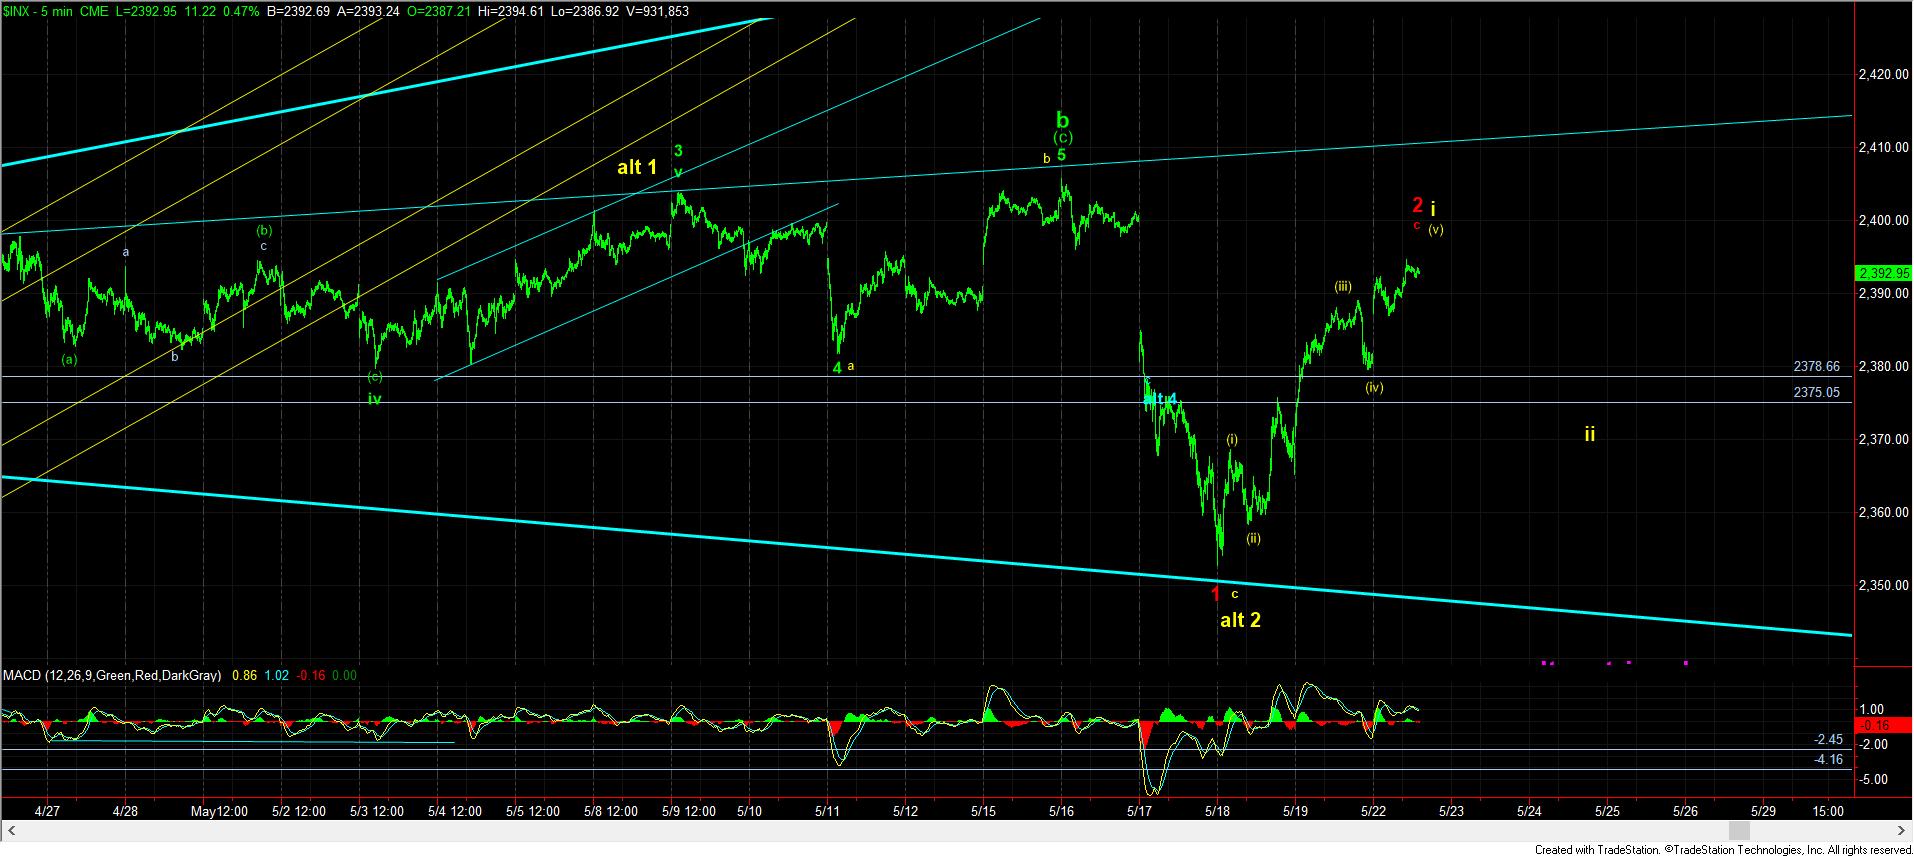
The SPX had a set up as of the close on Friday to gap down and drop to much lower levels in a larger 4th wave pattern towards 2285SPX. However, when we rallied instead to higher than last week’s rally high, it has now provided us with a very nice potential 5 wave structure off last week’s lows, and has given us a pattern we must respect and which can place a much more immediate bullish spin on the market. I have presented that count in yellow on the attached 5 minute chart.
With the potential of 5 waves up off the lows, I now have to take the yellow count on the chart much more seriously, since it can trigger yet another melt-up in the markets in June. But, we still have a few days to go before the market is going to provide us the trigger in that structure.
Primarily, I would still rather see the market break down to much lower levels, as I have reiterated in the past. But, those that have followed my advice have been using these drops to position themselves for the next larger rally we expect, rather than aggressively shorting the market. Remember, this is a bull market, and aggressively shorting within a bull market is not usually healthy for one’s trading account. Sadly, we all know of people who blew up their accounts trying to short this bull market for the last year, and it is not the wise thing to do.
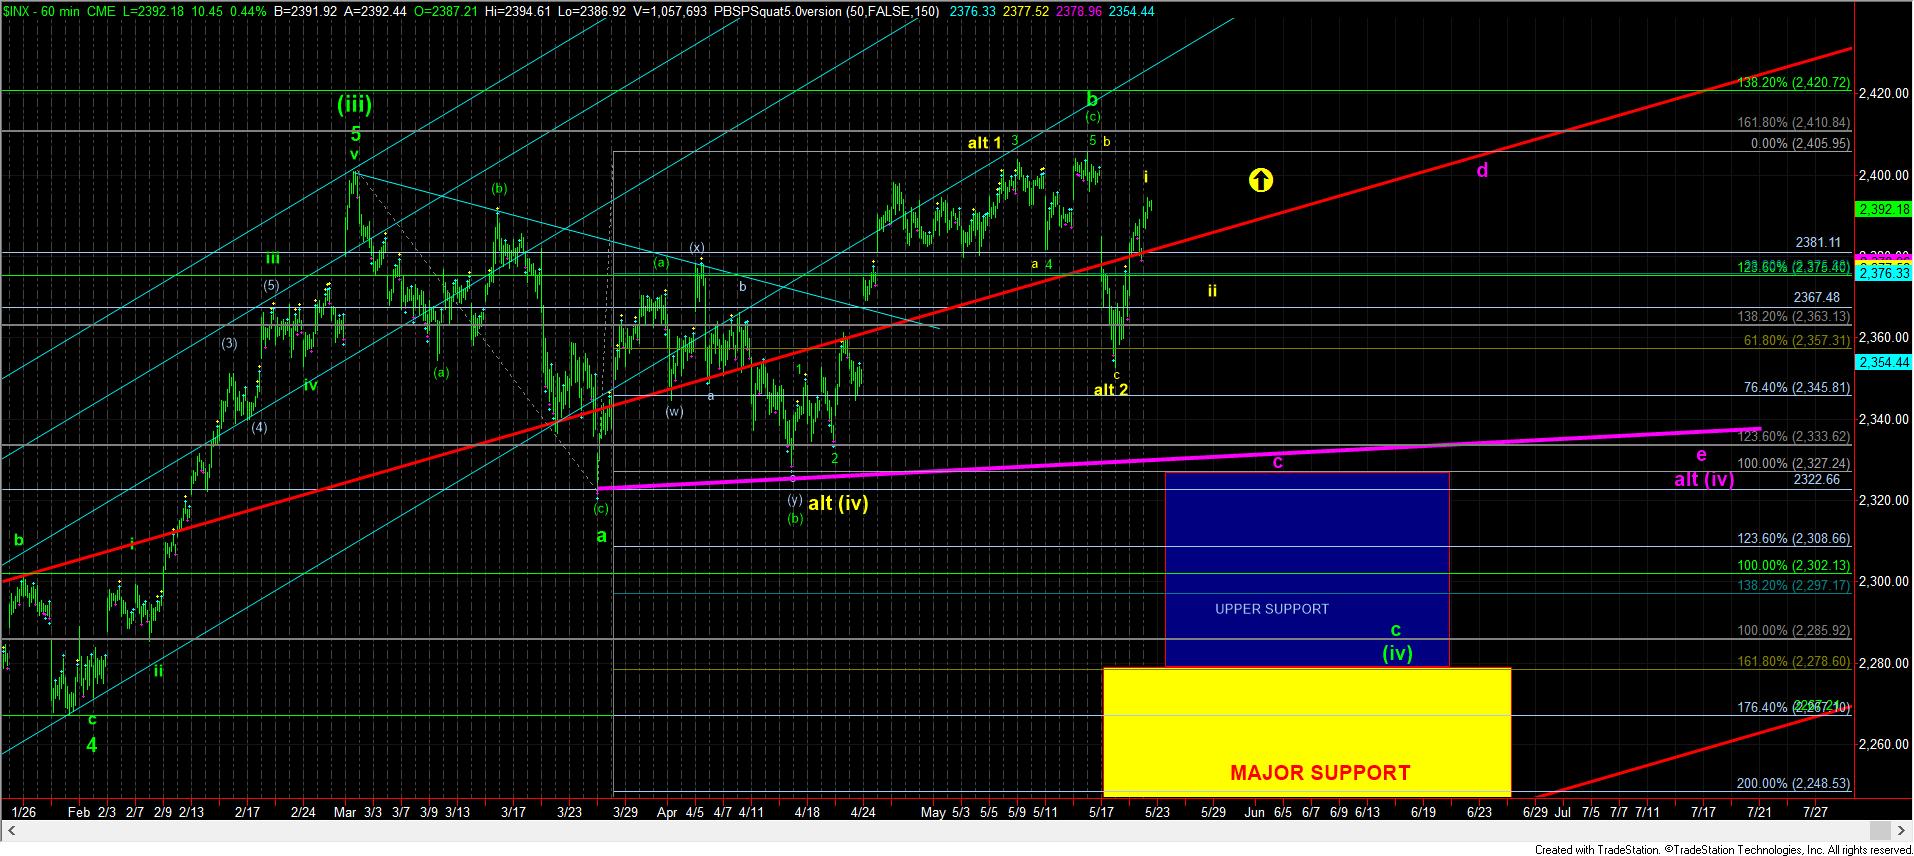
But, for now, I am going to continue to maintain my primary count that we can see another drop like last week, and potentially even more powerful, but I am going to be VERY quick to change that stance, as this rally today has reduced my conviction about seeing a bigger drop, even though the IWM/TF pattern still keeps me within that potential. What will cause me to change that stance will be a corrective wave ii pullback in the coming days, as shown in yellow on the charts, followed by a strong rally over the top of wave i, with follow through over 2406SPX. That would strongly suggest to me that we are in the heart of a 3rd wave towards 2500SPX sooner than I had initially expected.
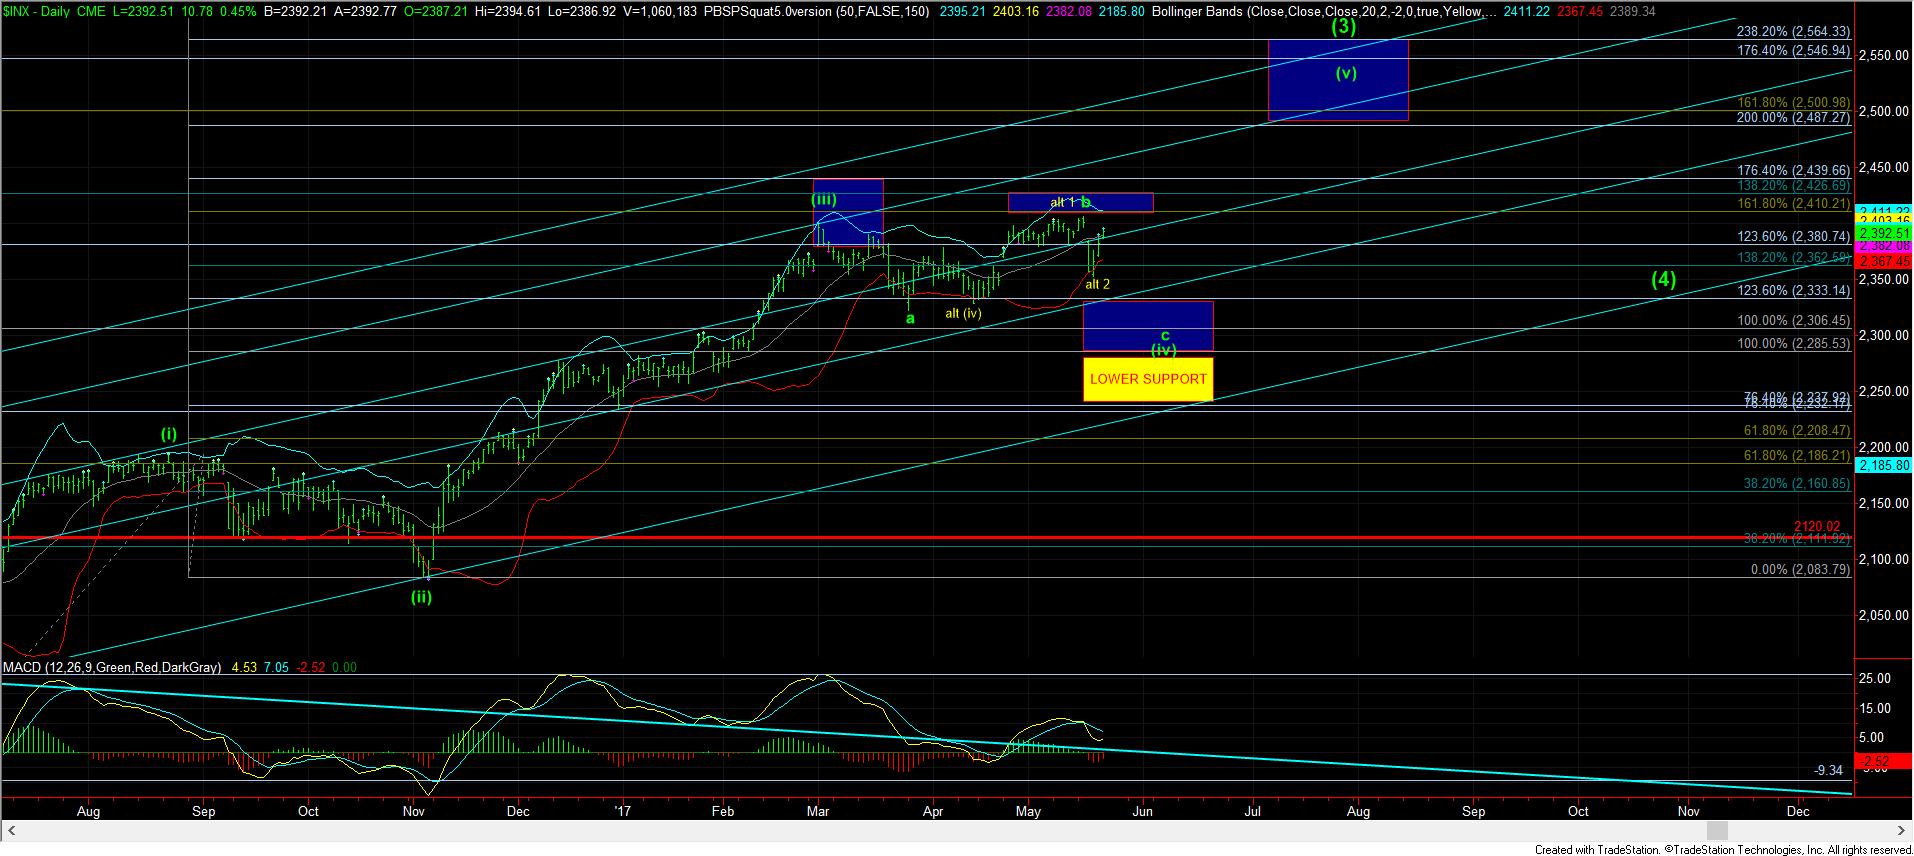
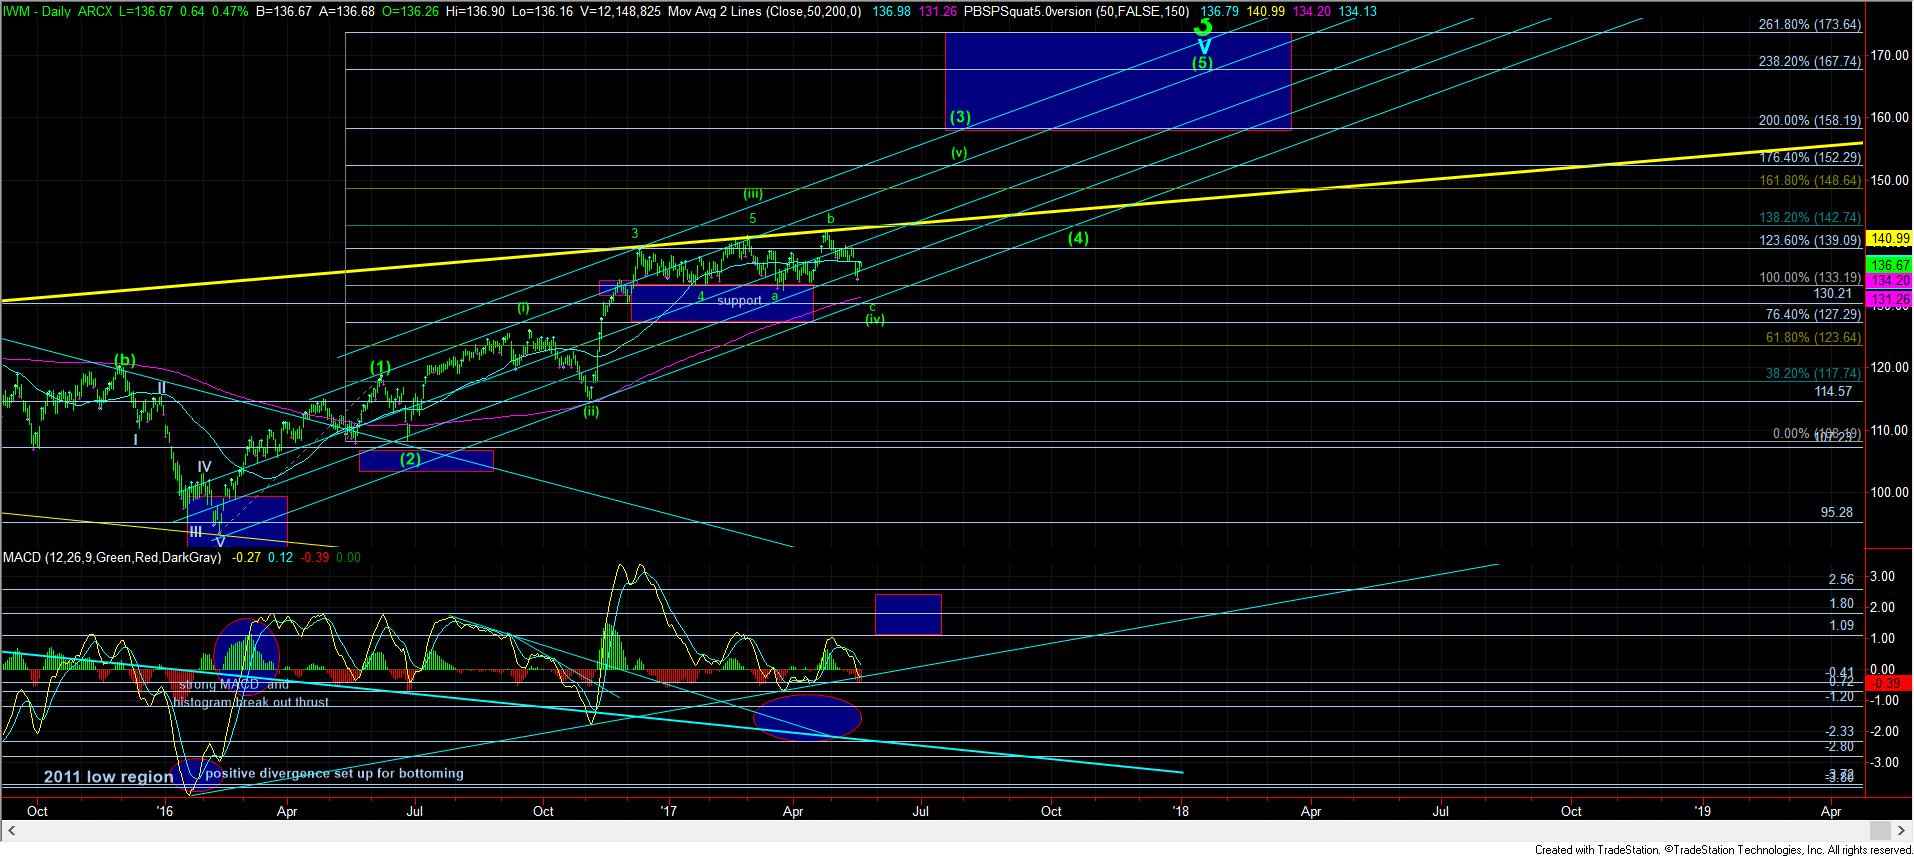
Lastly, keep in mind that the SPX has been consolidating in this same region since March 1. As we have been warning since that time, all we are doing is setting up our next rally to 2500SPX. However, if you look closely at the attached daily IWM chart, it has effectively been consolidating in this region since the end of last year. For this reason, I think we can see the IWM take the lead in wave (v) of (3), and potentially outperform the SPX in that segment of the rally.