Lack Of Alignment Causes Analytical Issues
 By
Avi Gilburt
I am going to start this update, and probably several others in the future, with something I said yesterday that I think deserves repeating often. I think this is how we are forced to view the markets going forward:
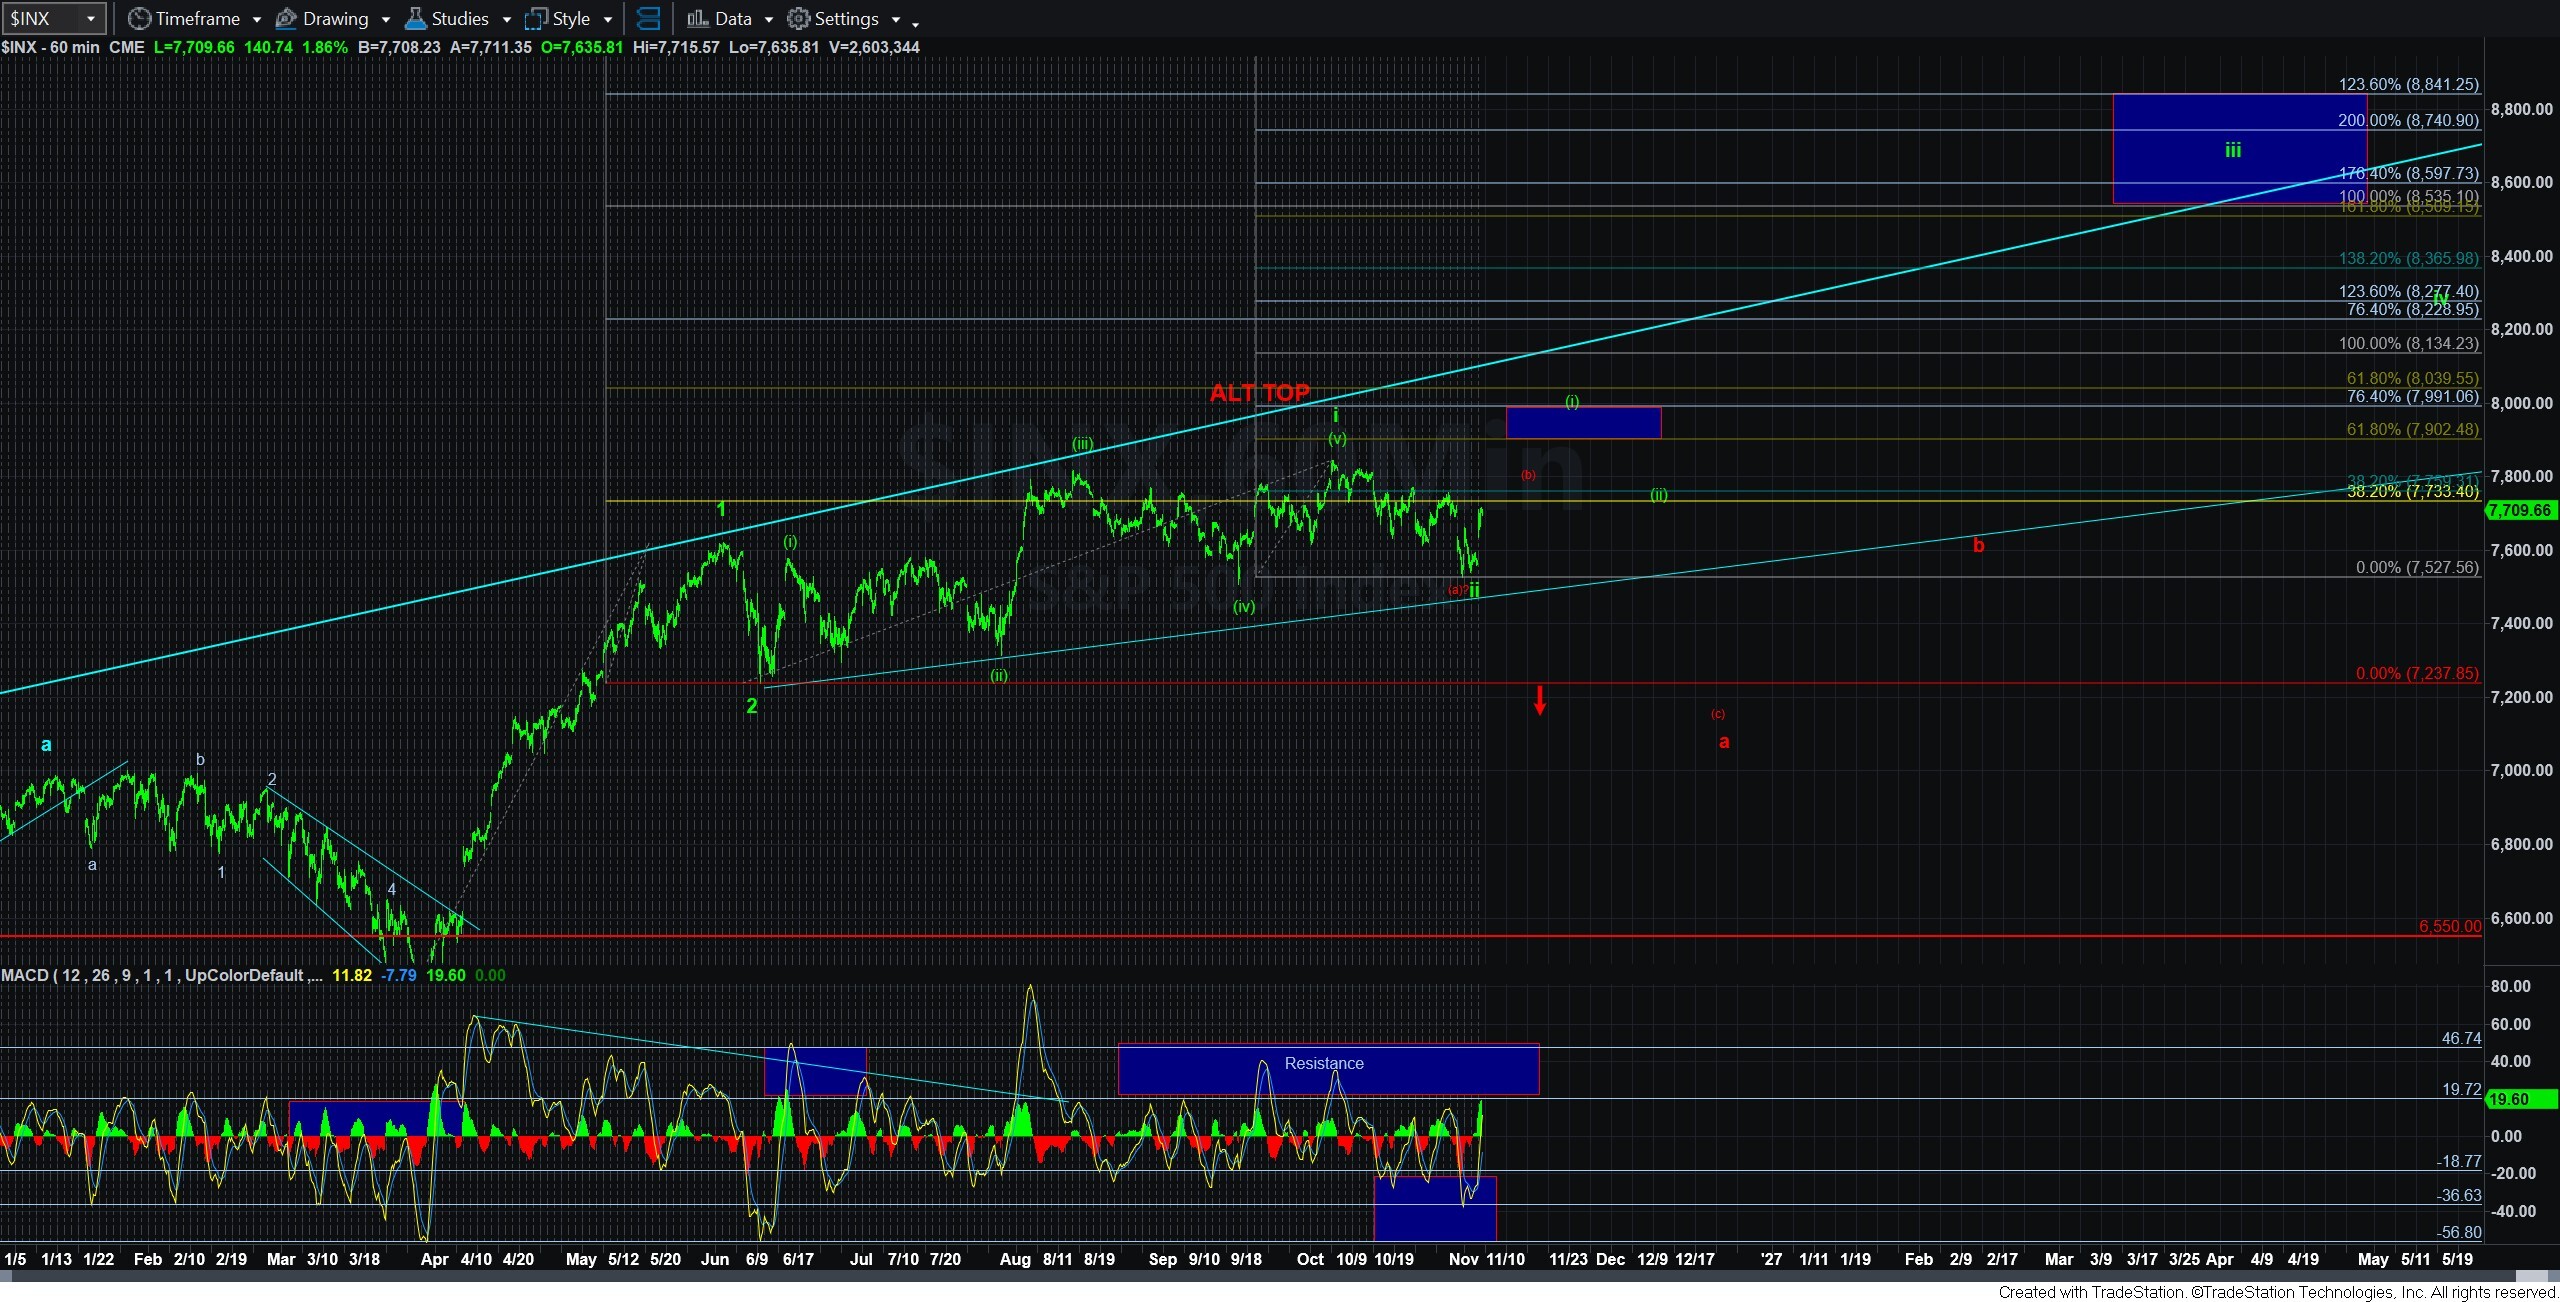
"In the bigger picture, there are still two main points you have to weigh. First, until the market breaks the 7237SPX level, we have no clear indications that a major top may have been struck already. And, second, this is a VERY mature bull market, especially when we consider that we are attempting to complete a multi-decade 3rd wave which began in 1932.
These two factors have to always be weighed when making decisions about how you want to be positioned as we go into the end of the year and potentially beyond. But, at this time, there is no CLEAR indication yet a major top has been struck, and until that happens, we have to respect the potential for one more bullish set up."
So, until the market actually invalidates the potential for another major rally pointing us north of 9000SPX, I think we are forced to view that as our primary count. Yet, that does not necessarily make this much easier, as the lack of alignment between the SPX and the ES has caused problems in performing our analysis of this action.
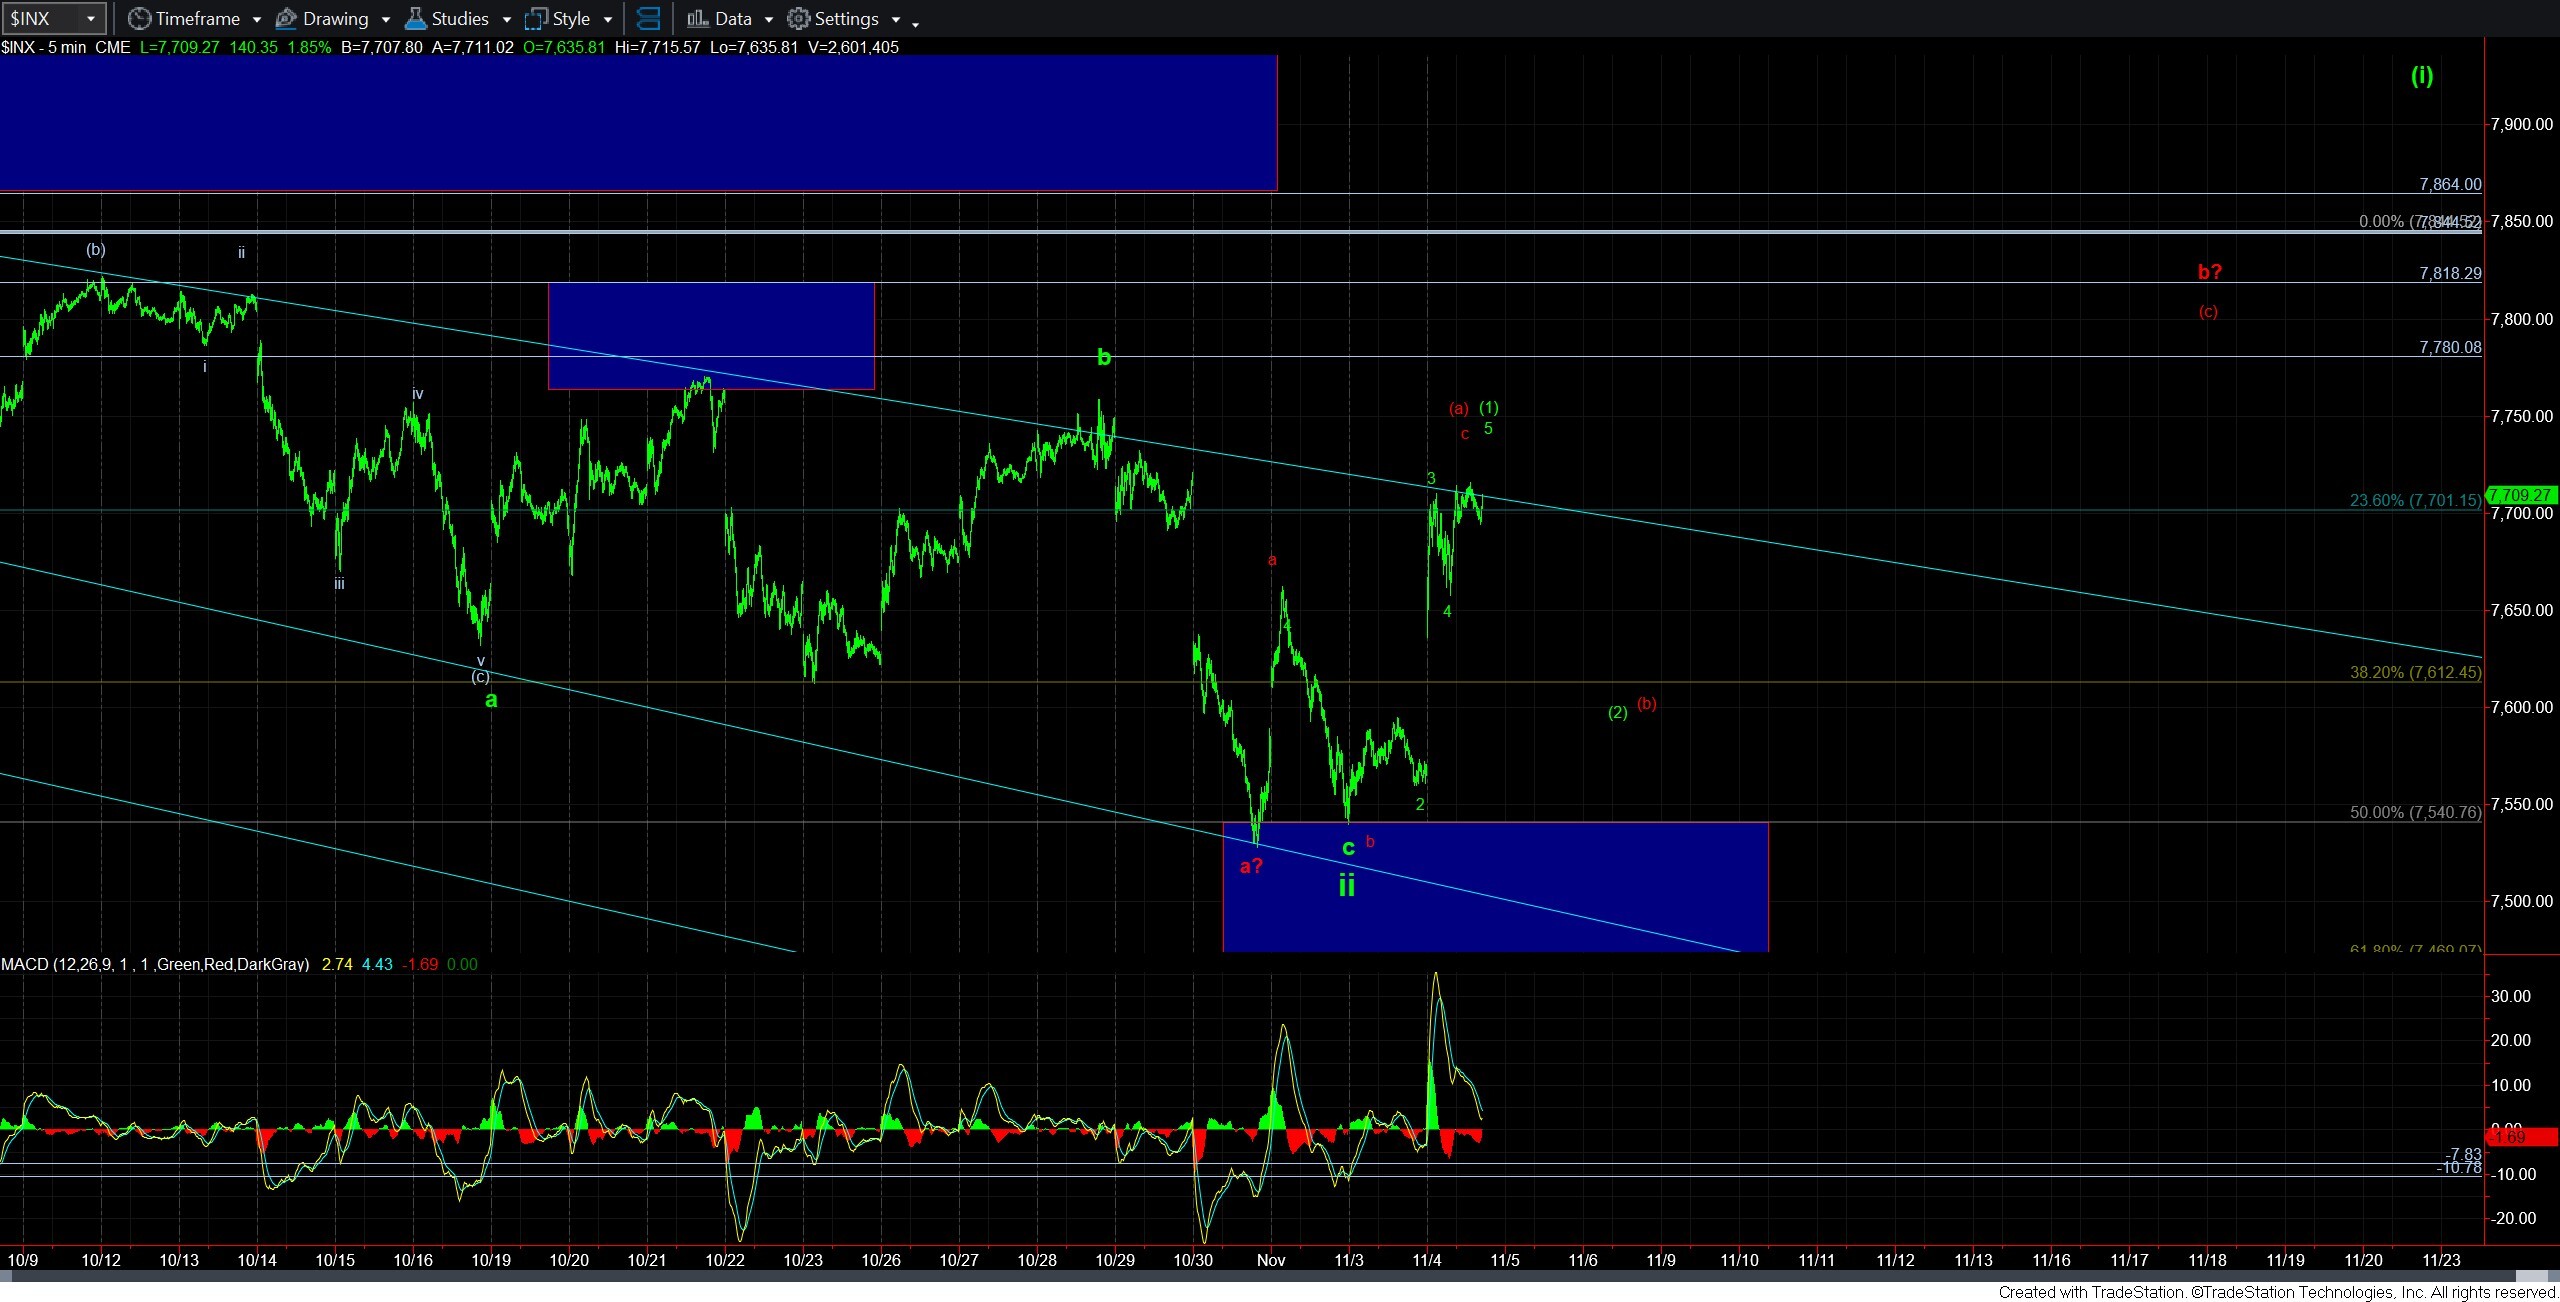
Not only did the futures make a higher high last week, but they made a lower low as well last, neither of which has been seen in the SPX. While it clearly could have completed the wave ii as I outlined in my ES chart from last night, the SPX is unfortunately leaving several paths open over the coming week.
While I can count this as being a 5-wave rally off this week’s low in SPX, unfortunately, it relies upon a truncated 5th wave in the c-wave of wave ii for the bullish count in the SPX. And, that is not a terribly reliable structure from my experience.
Moreover, the size of this rally in the SPX does not really seem to fit as large enough for an ideal wave (i) of wave iii of 3 in the bullish count. Rather, we may only be seeing wave (1) of (i) in the bullish count, as I am showing on the attached 5-minute SPX chart.
But, the issue with the truncated bottom is that it could just as well be providing us with an (a) wave bottom and the start of a b-wave corrective bounce, as per the red count. And, it would seem both counts would suggest a pullback can be seen this week.
So, what will give me more confidence in the bullish green count? Well, ideally, a larger degree 5-wave rally that points us up towards the .618 extension of waves i-ii, which is an ideal target for wave (i) of iii of 3. Should we see that in the coming weeks followed by a clearly corrective pullback, then this will make the green count a much higher probability.
Speaking of the bigger picture, I do want to repost something I sent out earlier today in the trading room:
“It's time to take a look at the bigger picture. Assuming wave ii is done, we are seeking another 5-wave rally for wave (i) of iii of 3 to make this path a much higher probability. Therefore, I would assume that wave (i) of iii can take us to a higher high towards the .618 extension of waves i-ii.
Moreover, take note that the target box for wave iii of 3, as set through the 1.00-1.236 extensions of the larger degree waves 1-2, aligns quite well with the smaller degree, as the bottom of the wave iii box is the 1.618 extensions of the lesser degree of i-ii. This type of alignment gives me a bit more confidence in this structure when we see such confluence.
Lastly, I have added a pivot on this chart as the .618-.764 extensions of waves i-ii, which when exceeded, makes it a very high probability that we are on our way to the target box overhead for wave iii. So, let's take this one step at a time, and see if the market gives us an appropriate wave (i) of iii.”
So, with some internal confluence within the upside structure potentially pointing to a bigger rally as we look to the end of the year, and into next year, along with the fact that we have no indications that a long-term top has indeed been struck, it again leaves me interpreting the evidence as suggesting to give primacy to the bullish green count until it invalidates, or at least provides further evidence of lack of follow through.
And, in the near term, I am going to try to make some sense of the differences between the SPX and the ES, and see if we can find some alignment in the coming days. Until such time, I am just going to follow the SPX – as the old saying goes, cash is king. And, as I noted, I think both would look best with a pullback for either a 2nd wave in green or a (b) wave in red.