Key Spot As The Equity Markets Test The Lower End Of Support
 By
By
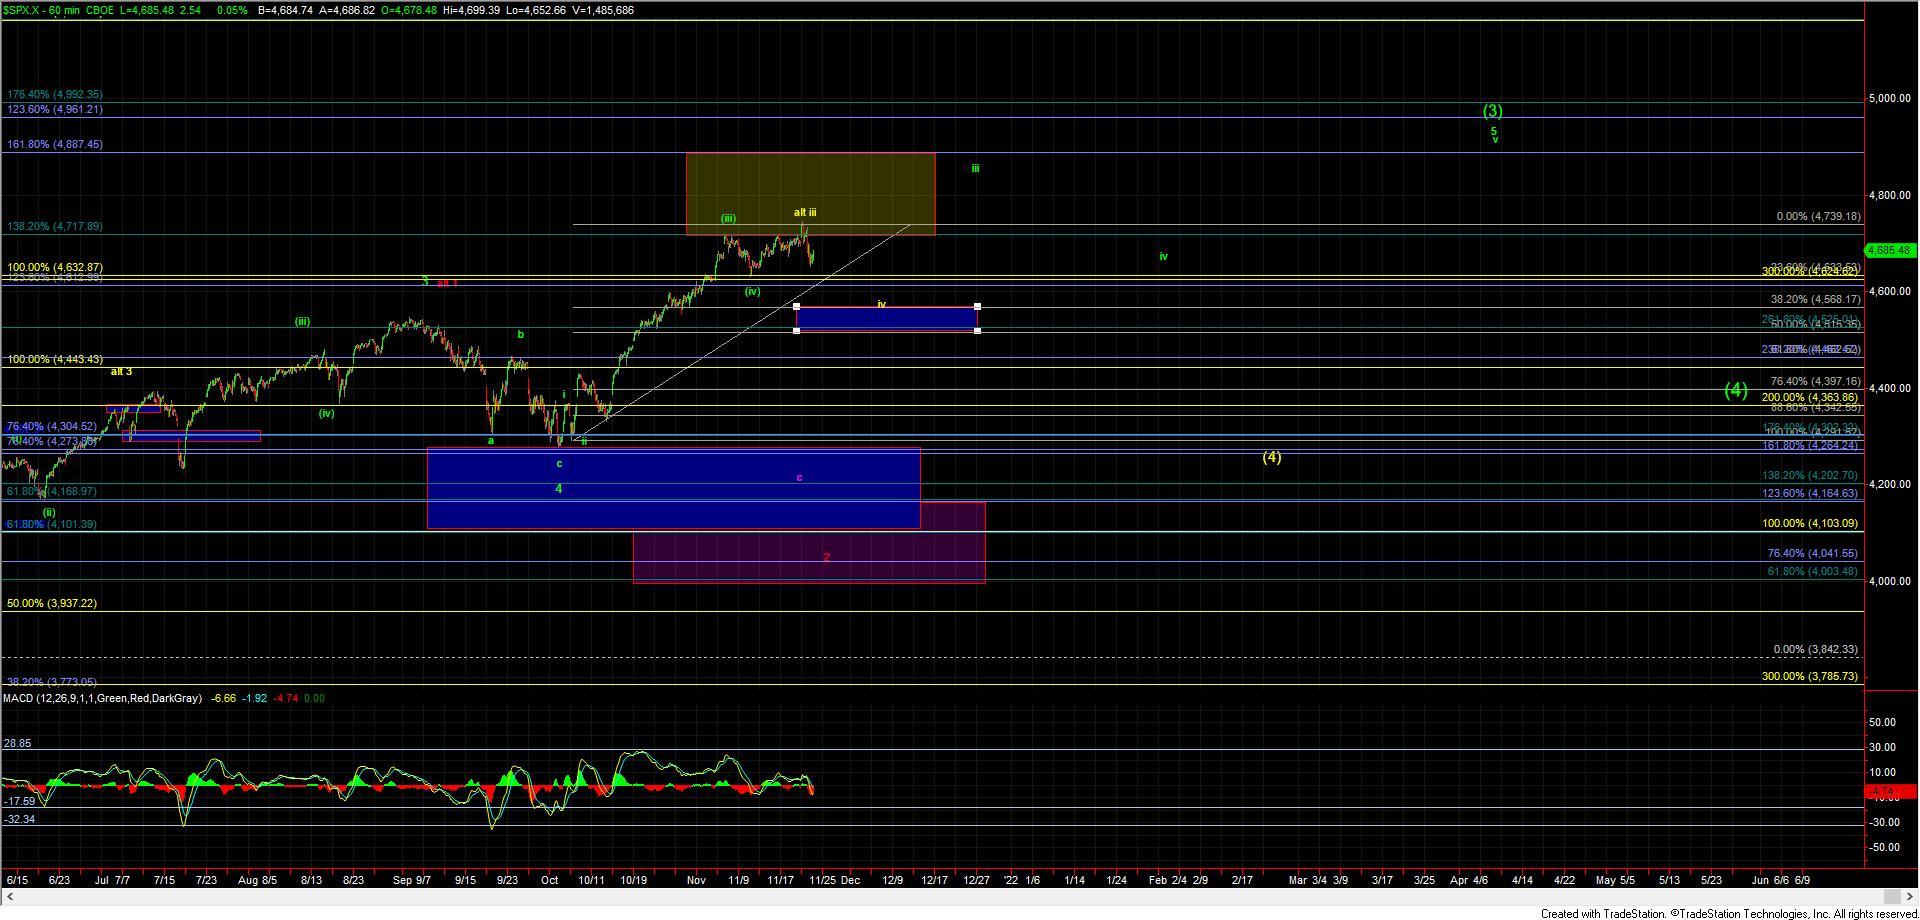
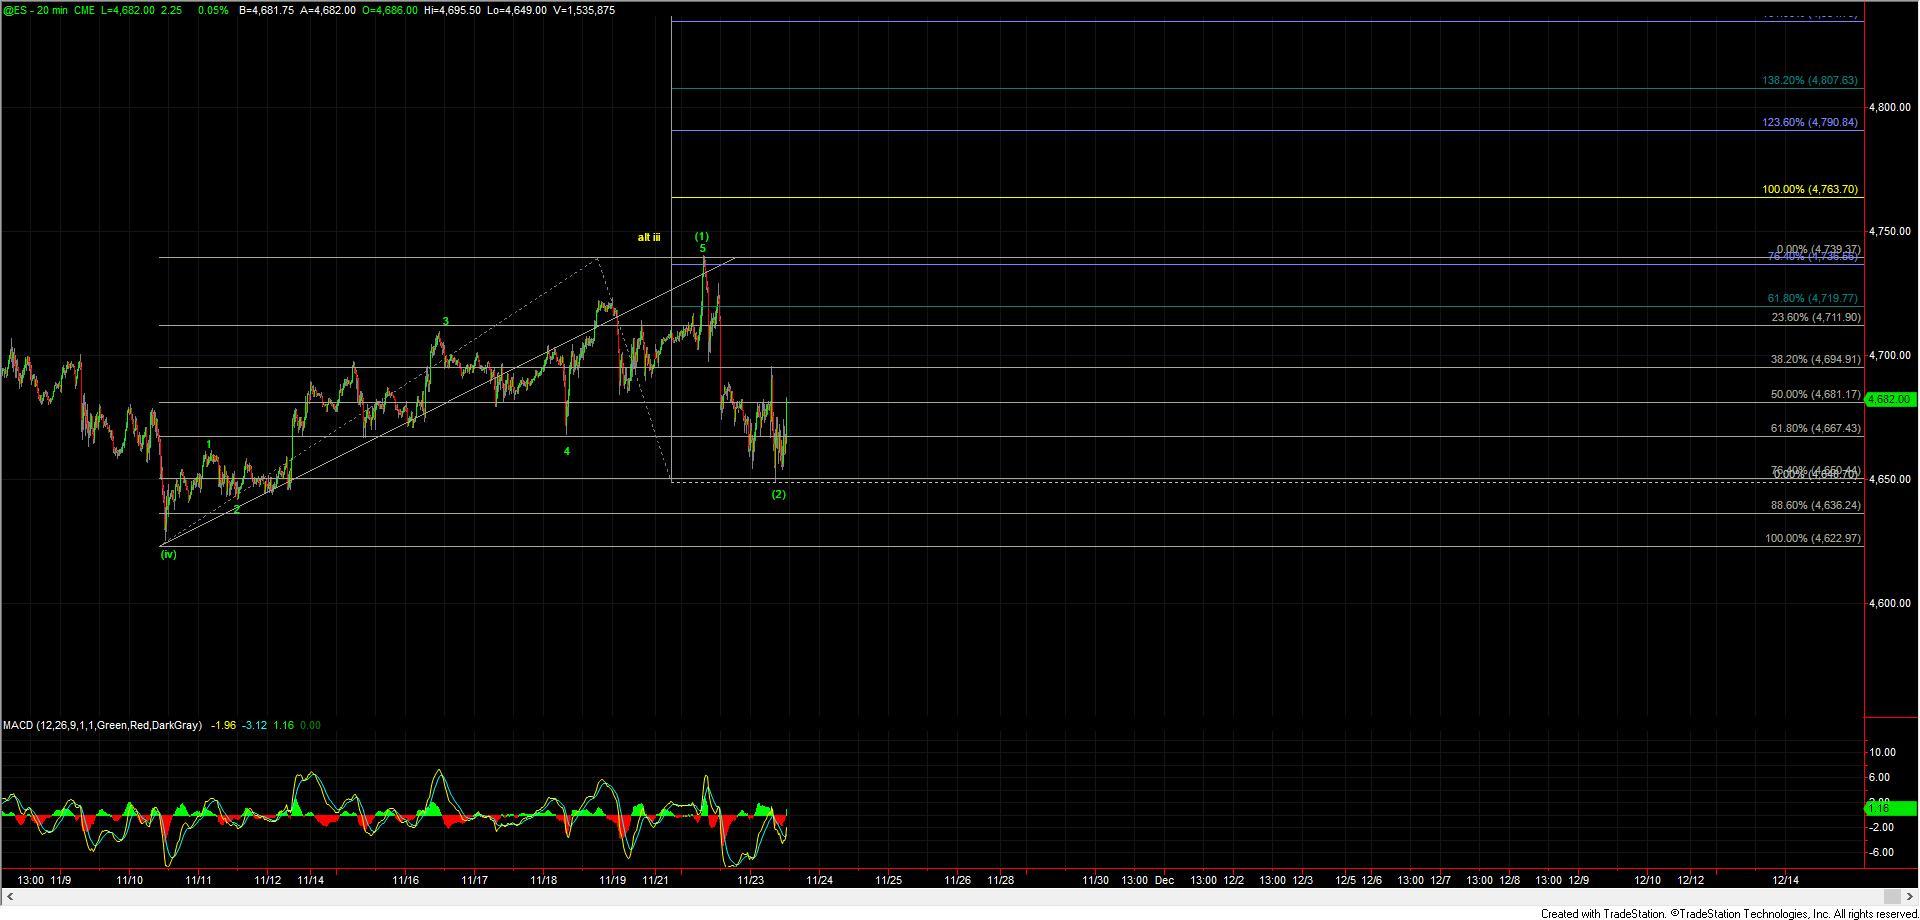
ES/SPX - After moving lower overnight we really have not done too much here during the regular hours trading session. With the deep retrace on the ES down off of the highs, the only way to count the move up off of the 4622 low is as a diagonal as there is overlap within the entire structure. The question at hand is whether that move is an ending diagonal to finish off the yellow wave iii or as a leading diagonal as part of a wave (1) of the larger wave (iii) per the green count.
My base case at this point in time and as long as we can hold over the 4650 level on the ES is that this move up off of the 4622 low was indeed a leading diagonal as part of a wave (1) and not an ending diagonal topping in the yellow wave iii just yet. This view fits better with what I a watching on the other index charts as well as my primary count on the VXX. Should however we break below that 4650 level on the ES I will adopt the yellow count as my base case at which point the wave iv at which point support for the wave iv will drop down into the 4568-4515 zone.
So although the action on the micro timeframes is still quite sloppy we still have yet to break even the most immediate bullish path as shown in green on the charts. We do however have fairly clear parameters as we head into the end of the day and we should have an answer as to which of the two paths we are likely going to follow in the next couple of trading sessions.