Key Parameters for the Week Ahead
 By
By
Today we saw the open fairly flat and then push higher after the FMOC announcement only to be quickly rejected after moving higher and we are now trading flat again at the time of this writing. Overall the market has remained in quite a sloppy and complex pattern which is leaving the door open to a number of possibilities. Furthermore, we still do not have a full or clean five up off of the March 13th low we still do not have confirmation that we have indeed put in a larger degree bottom at that low. Additionally, because we seem to have corrective wave action in both directions over the past several weeks we have to allow for the potential for this to be developing a larger triangle from the highs that were struck back in December. Under all of these potential paths until we see a bit more wave structure it is going to be hard to have a high degree of confidence as to which path will ultimately play out. We can however lay out the parameters in which to watch to help give us better guidance as we move into the week ahead.
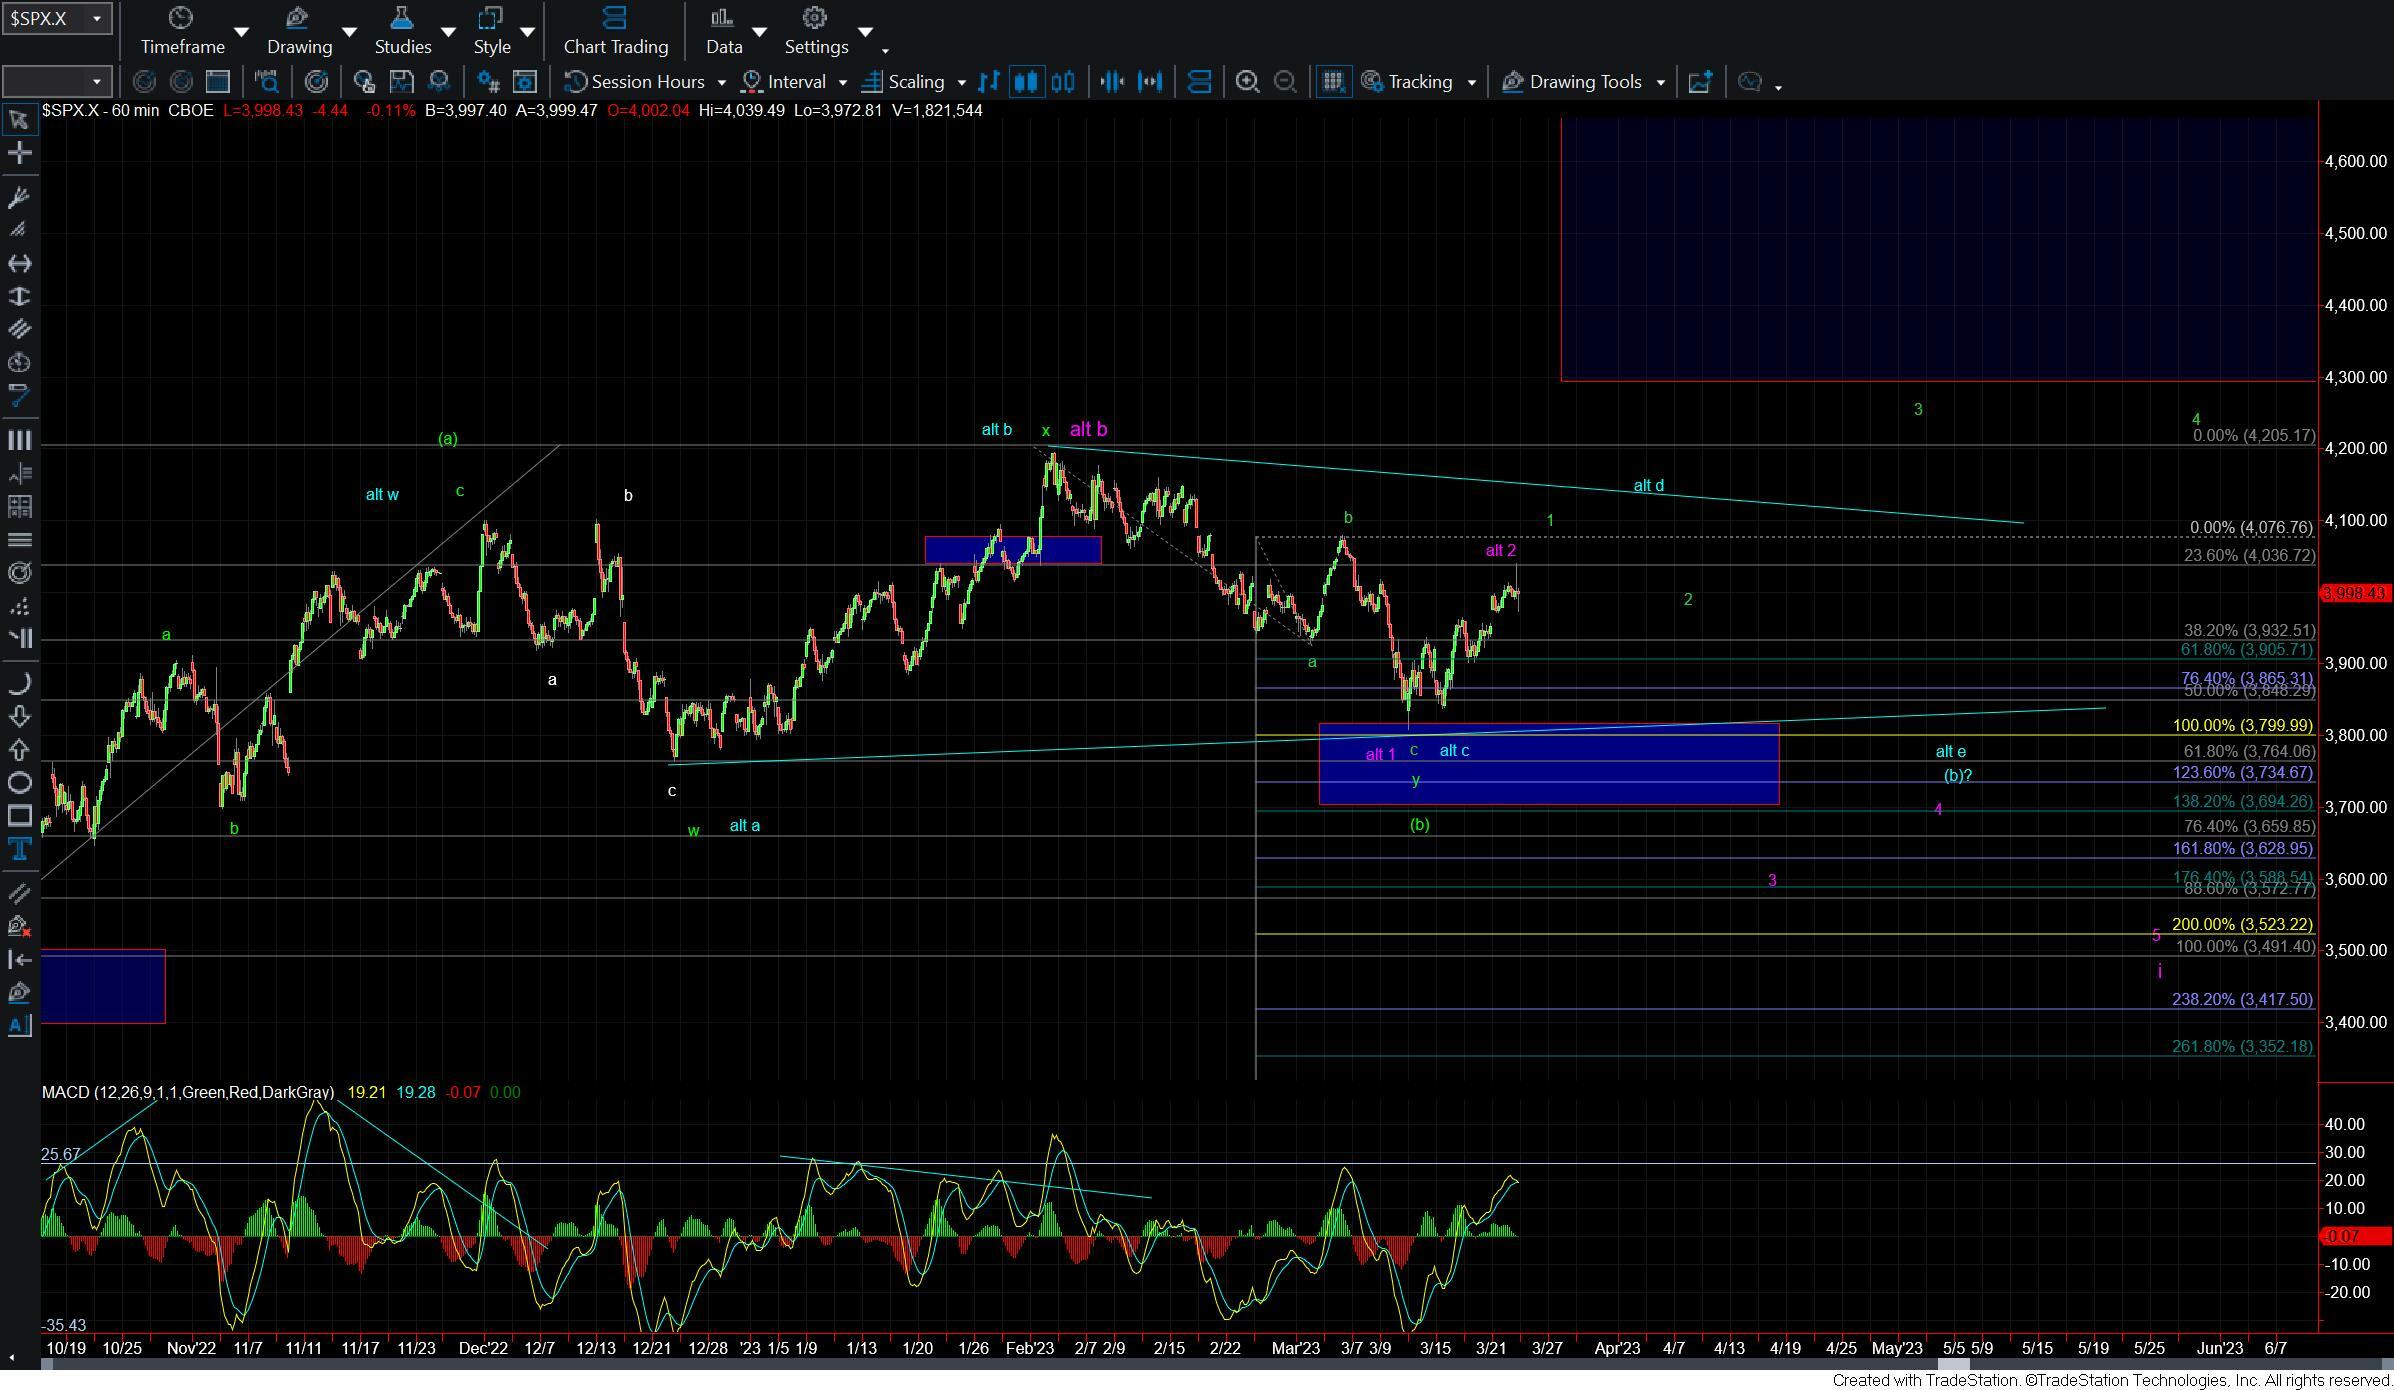
Under the green count we still ideally should see another wave (iv) and (v) to finish off the larger wave 1 up off of the March lows. Because the wave action up inot current levels has been corrective in nature however this five wave move is likely going to have to take the form of a leading diagonal. So even if we do get five up off of the lows we still need to see confirmation that we have indeed bottomed in that five up with a corrective retrace lower followed by a break back over the top of the wave 1. As we are moving lower into the final hour of trading and now under the 3980 level I think it is reasonable to consider the wave (iii) under this case to have topped. The MACD on the 60min chart also seems to support this as it is quite oversold at the moment and beginning to roll over. Under this case I would want to see the wave (iv) hold over the 3936-3912 zone and breaking that zone would give us an early warning that we may be following either the blue or purple counts.
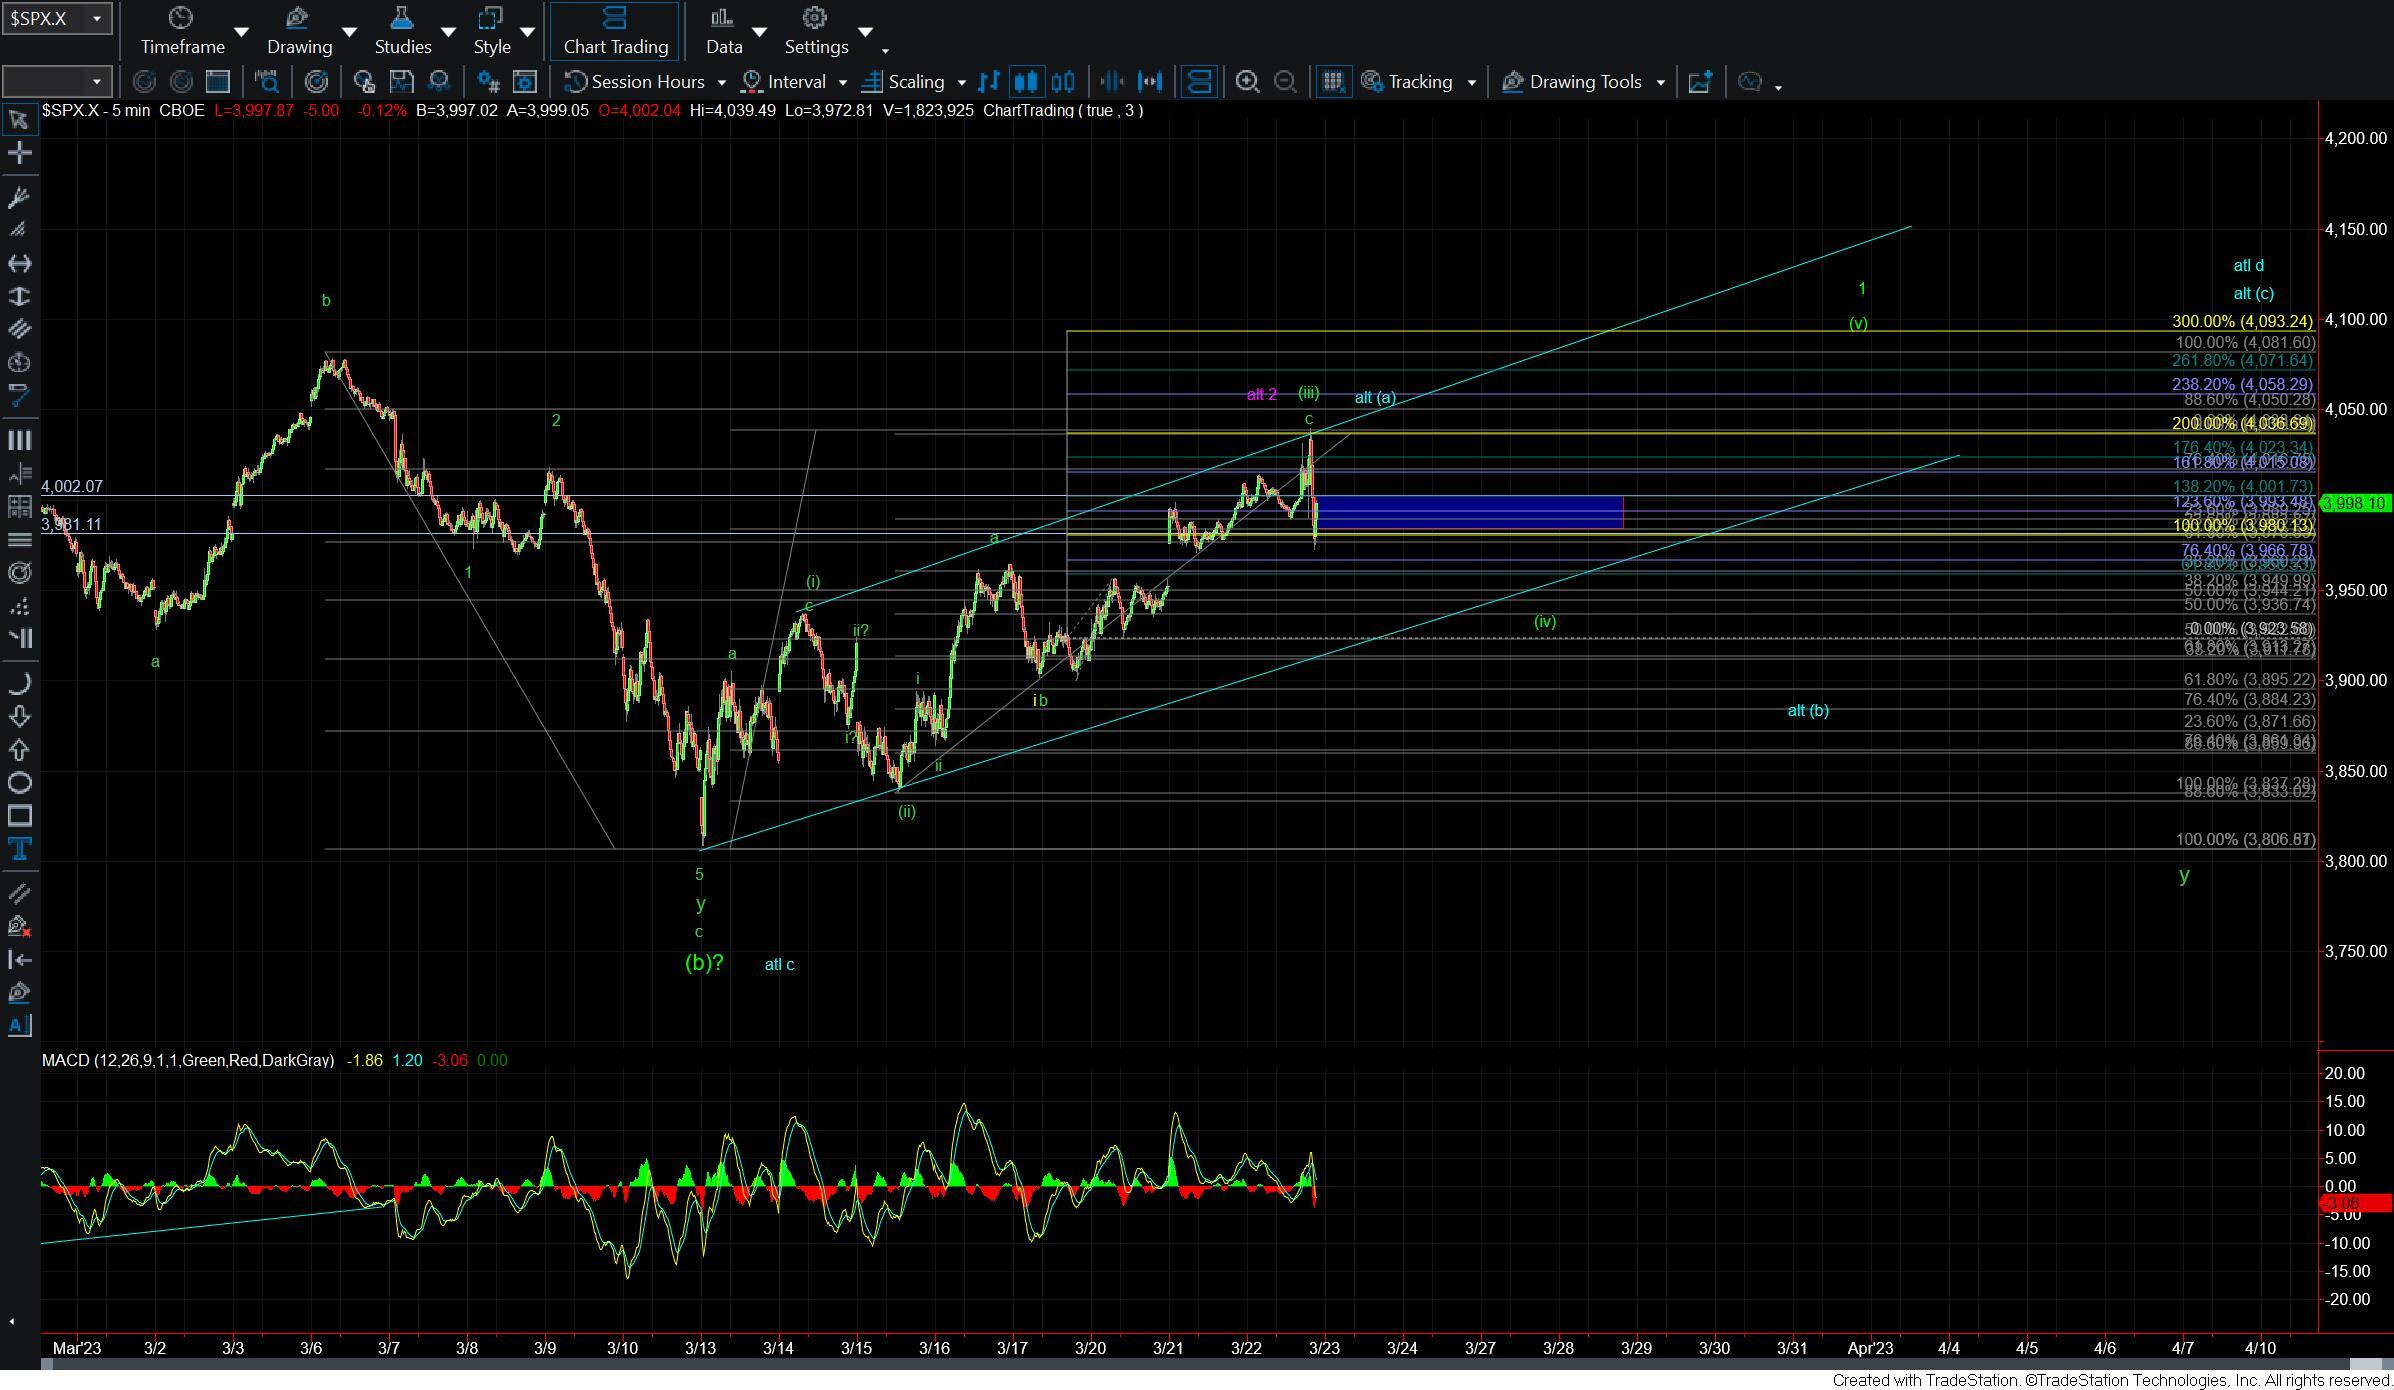
The blue count would suggest that this entire move up from the December lows is a larger triangle for the wave b. This should ultimately resolve to the upside in a larger wave c. That being said we likely would have quite a bit more time to work out the internal sub-waves of this triangle before this wave b is completed. Under this case, I would likely count this move down as a wave (b) as shown on the 5 min chart and we should hold over the 3924-3861 zone. If that zone breaks then it would open the door to the purple count.
Under the purple count, we would have topped in a larger degree wave 2 and have already begun a wave 3 down. We would need to start this move to the downside with a full five wave move and a break of that 3861 level as noted above. The wave 3 under this case would target in the 3694-3588 zone with the ultimate targets for the wave 5 in the 3523-3417 region. For now, this purple count remains less probable as there are several issues with both the fibs and the structure of this count however until we can break back over the 4076 level I will leave it on the charts as a possibility.
So overall the price action has remained quite sloppy over the past several weeks and we need to remain vigilant in this market. We do however have fairly clear parameters laid out and we will continue to monitor the price action as we approach these price parameters in the week ahead. In the meantime, caution is warranted in what continues to be difficult and somewhat sloppy price action.