Just Going Sideways - Market Analysis for Jan 29th, 2019
For the last few weeks, the market has basically spent its days within a 75 point region. Clearly, this is a much different environment than we have been used to for the last several months.
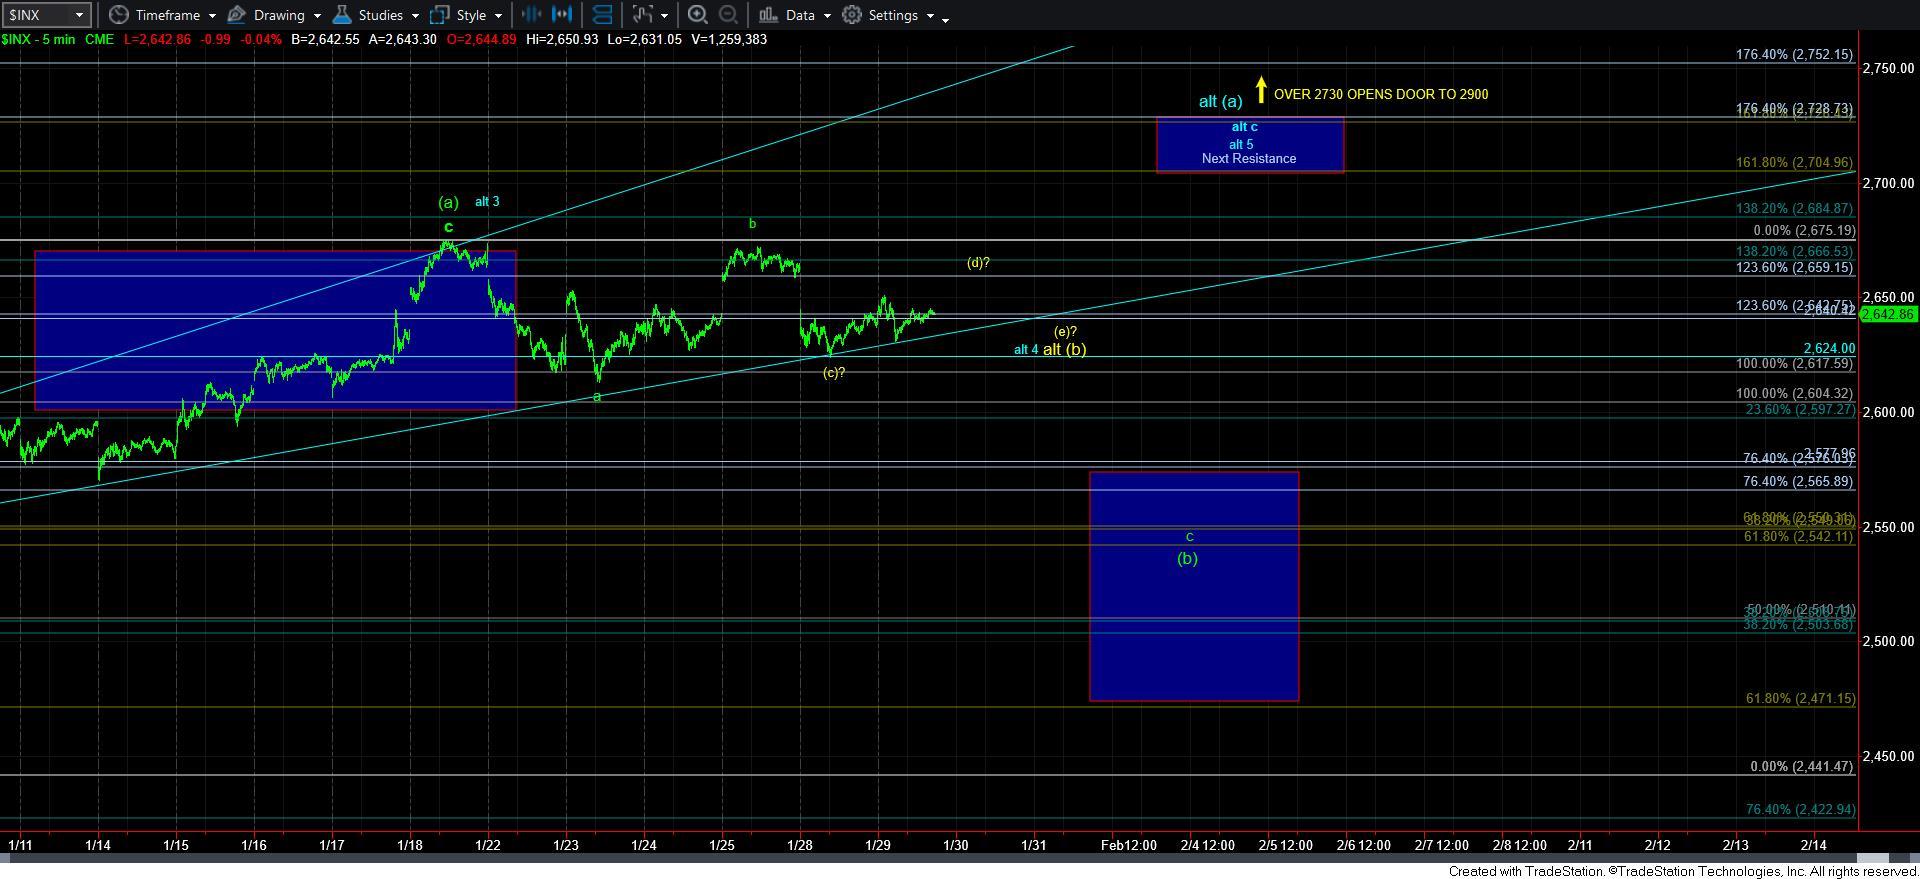
When it comes to the micro count, there is not much more I can add to what I outlined last night. For now, 2624SPX is the support beneath the market. As long as we hold that support, and trace out a triangle, the market can point us to the 2705-30 region, as outlined last night.
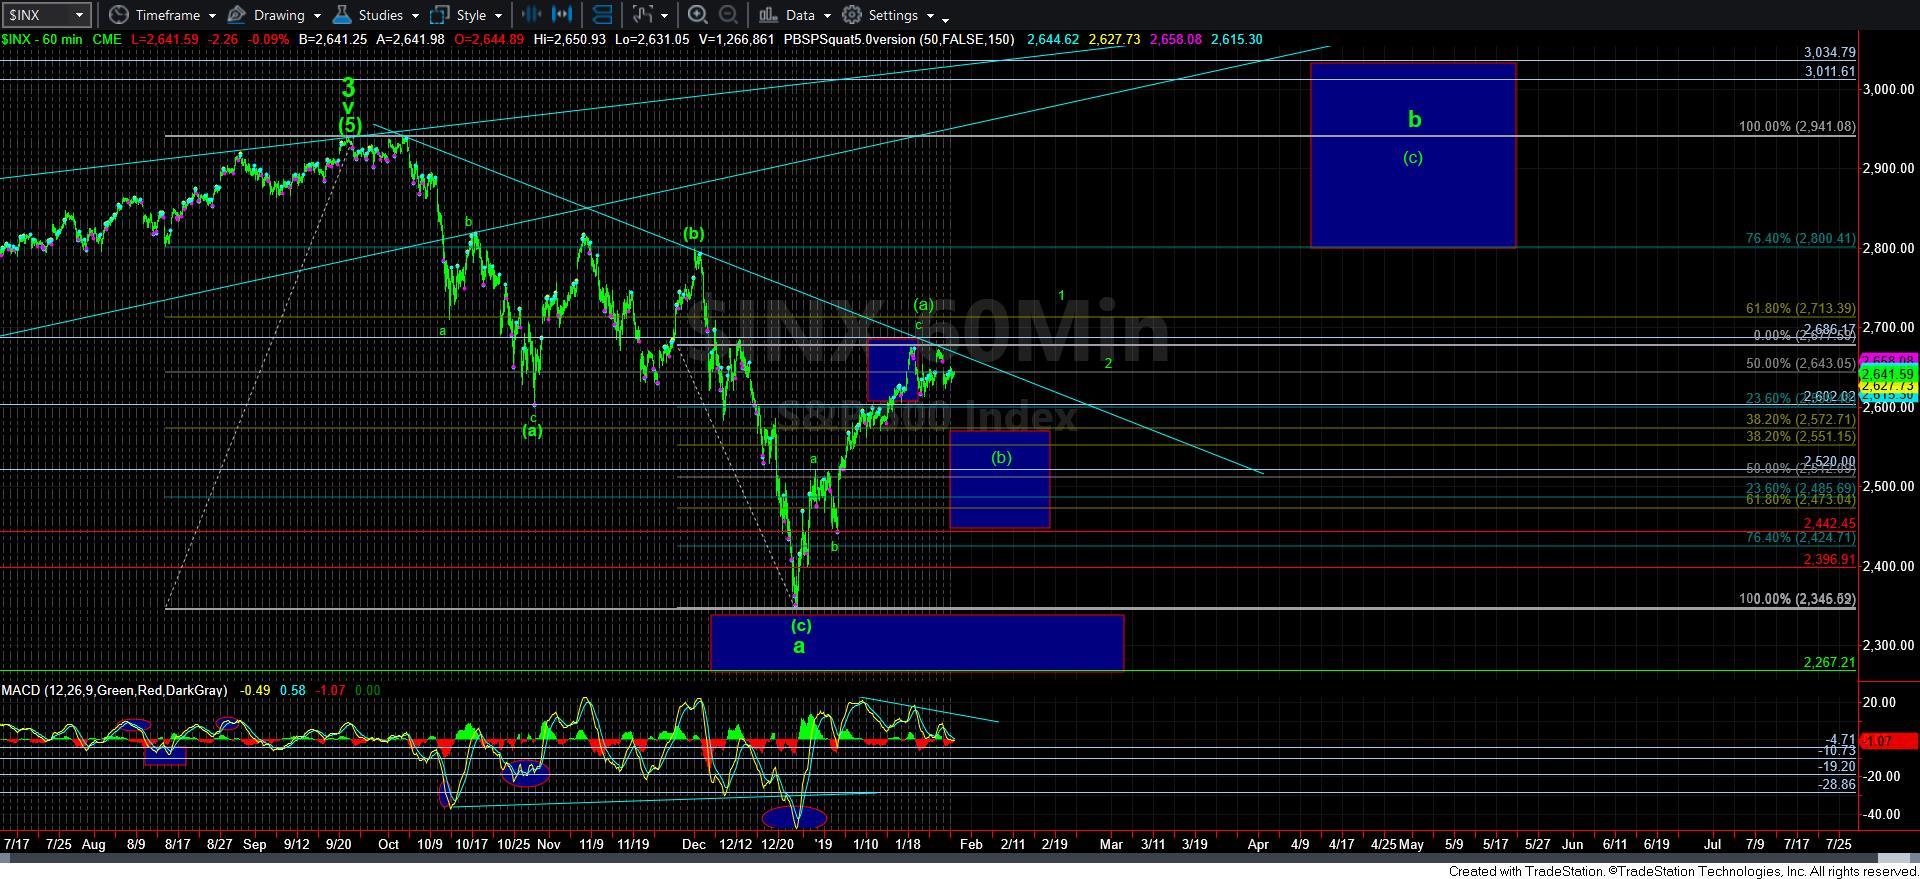
However, should we break below 2624SPX, it certainly opens the door to the deeper (b) wave pullback we wanted to see, with a minimum target of the 2550-70 region based upon minimal standard projections. And, please note I did have to move our [b] wave target a bit higher due to this projection. Should we begin a decline, we can narrow our target box for the [b] wave.
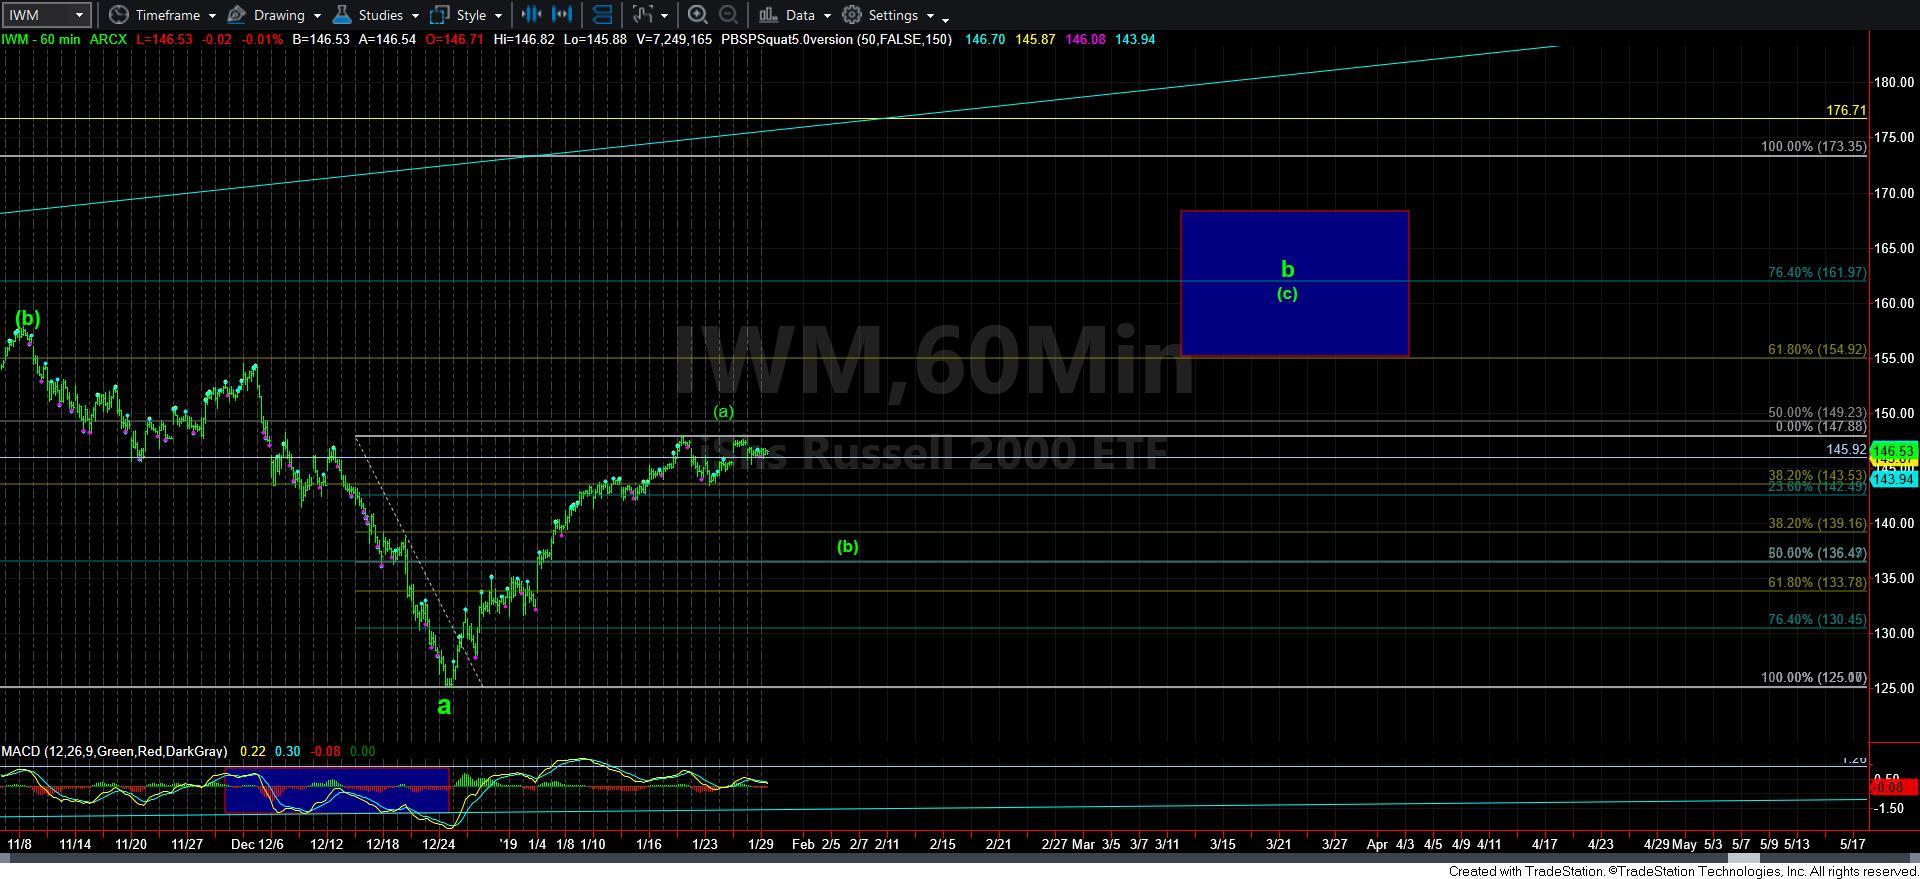
The one thing that I do want to add this afternoon is that the IWM does not even have a potential [b] wave triangle to which we can point. It is sorely in need of a [b] wave pullback, and even if we do see a bit higher in this [a] wave, it is strongly arguing for a potential pullback to be seen into February.
So, for now, my primary expectation remains that we can see a [b] wave pullback to lower levels, but the SPX is going to have to break below 2624SPX to signal it is in progress sooner rather than later.
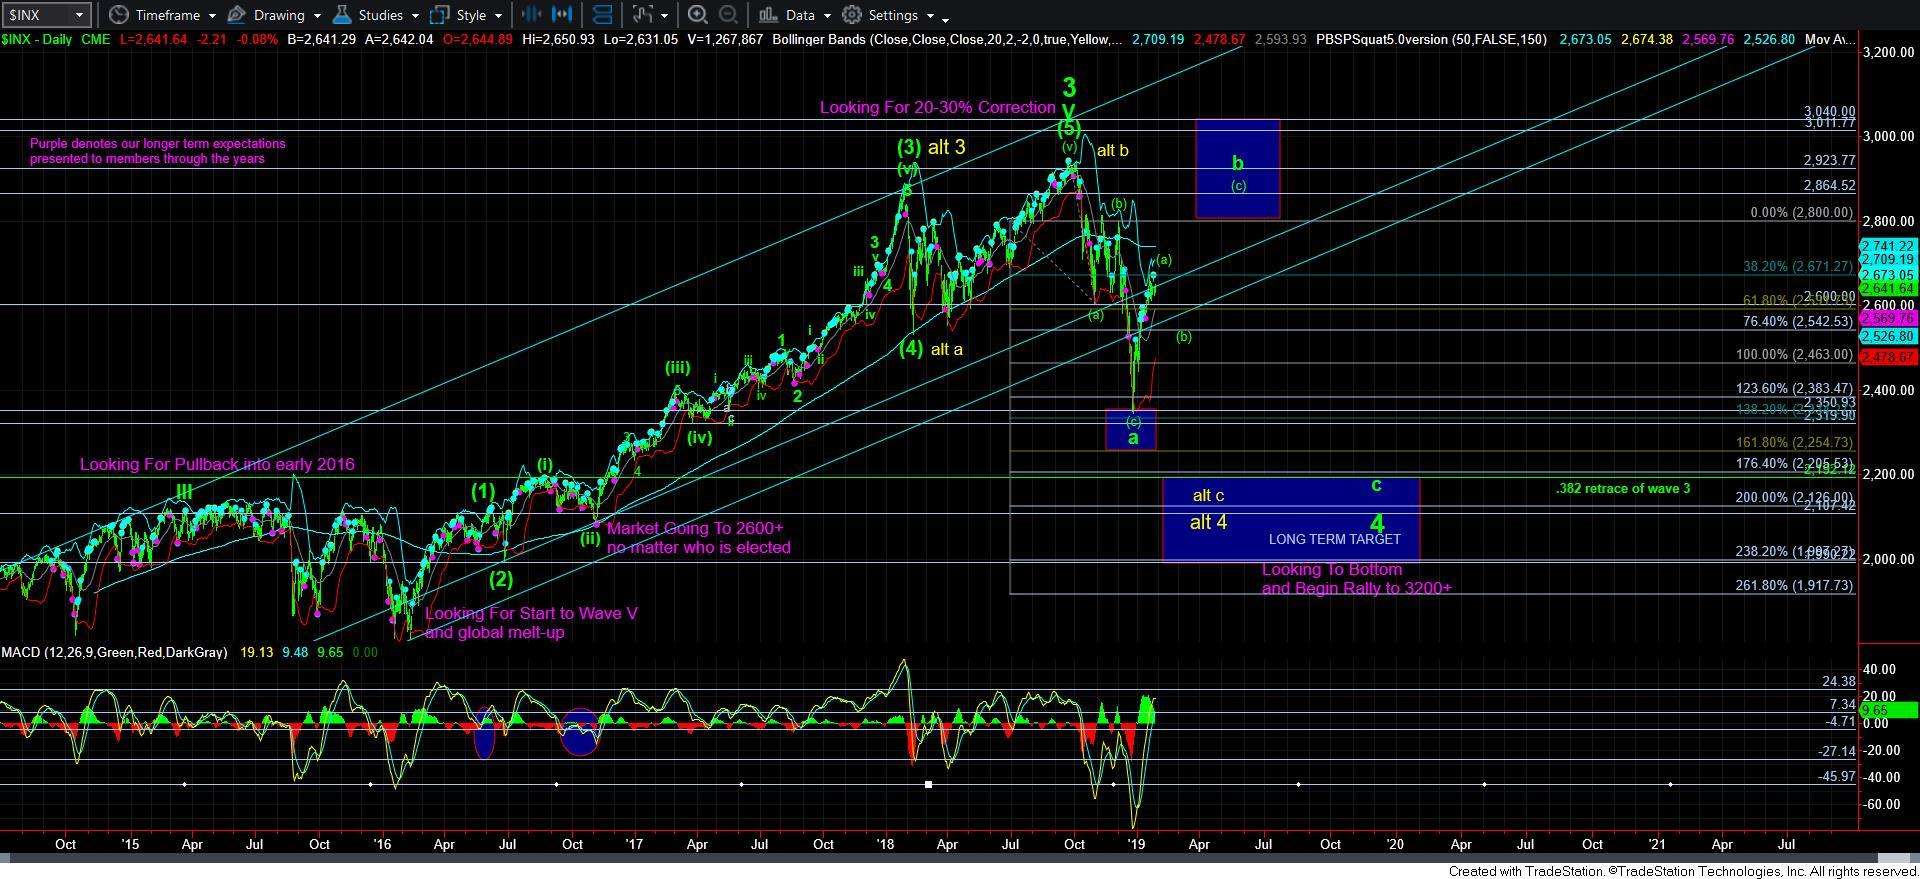
One last note. Since so many complained they could not see the alternative count in dark green for the [b] wave triangle, I have changed that color to yellow. Hopefully, we can take it off the chart soon, and get a real [b] wave pullback before we rally up to 2800SPX.