It's Decision Time - Market Analysis for Apr 14th, 2016
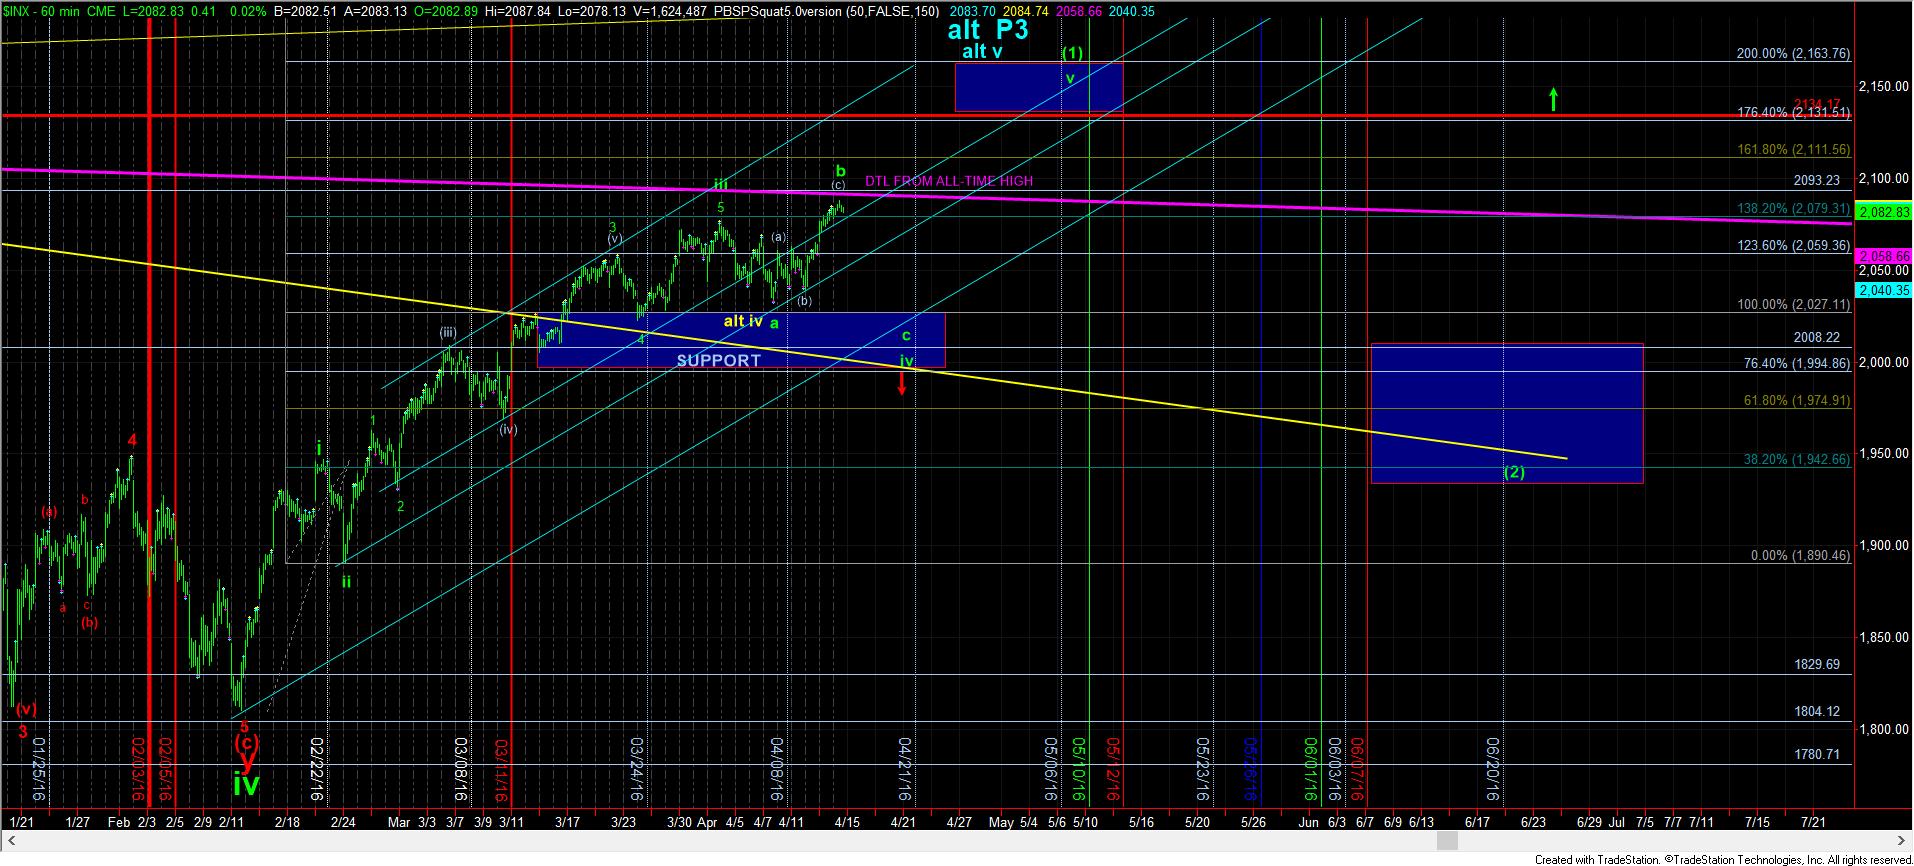
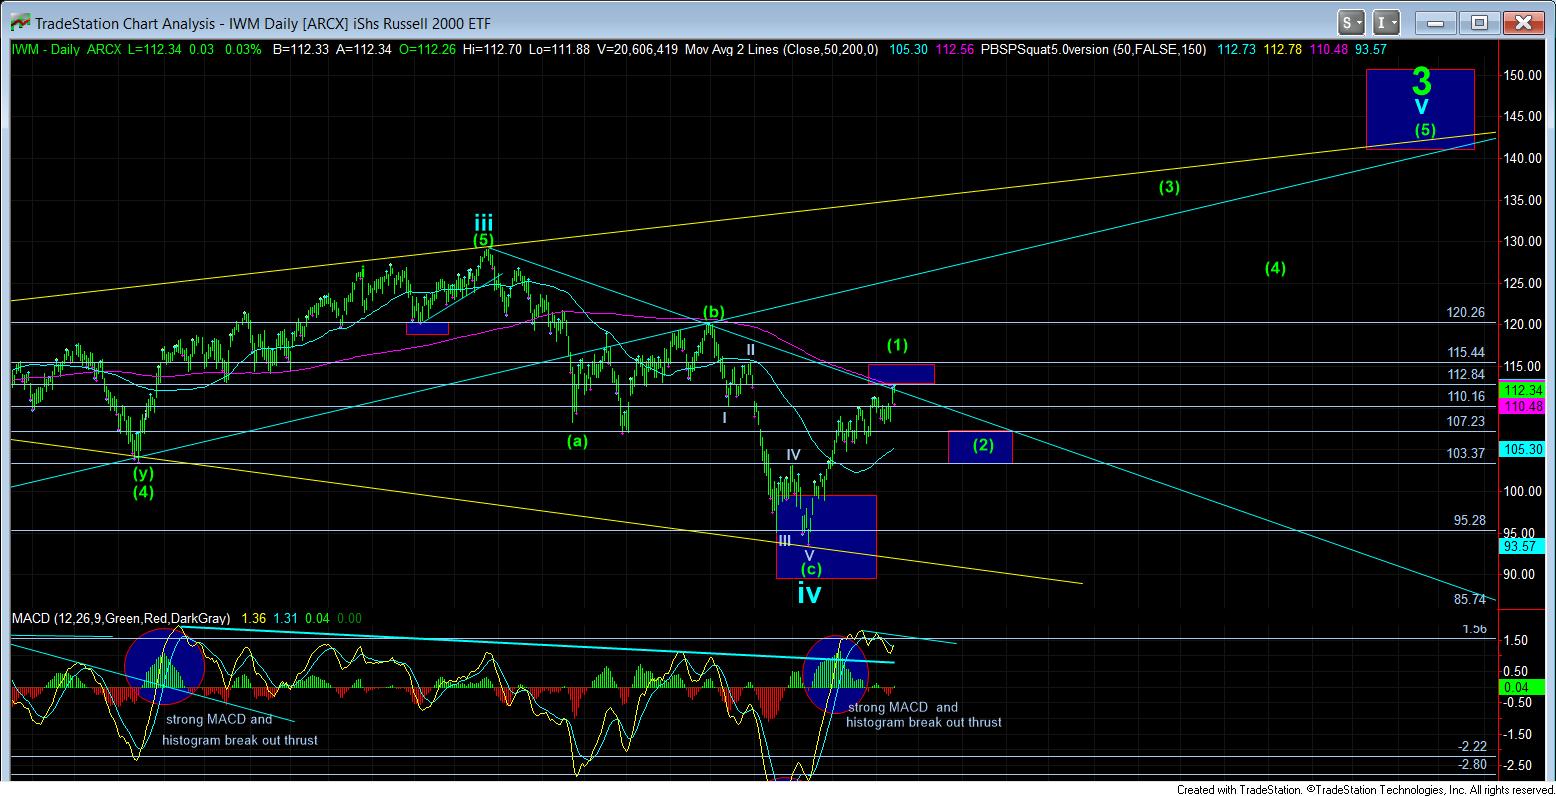
One cannot ignore what is right before us in the market. As you can see from the two attached charts, the IWM and the SPX are both at the long term down trend lines formed from their respective all time highs. The IWM is also hitting its head on its 200DMA. And, we have a rather stretched b-wave count on both charts right into this region.
Often, when the market approaches a resistance such as this, it does not bust right through it, but pulls back before it is able to successfully punch through such strong resistance. So, for now, that is my expectation. Therefore, I still view us as having just about completed an expanded b-wave in both markets, which should set up a c-wave decline into next week.
Alternatively, if the market were able to gap over this resistance, without strongly reversing back down, then I will view us as having already completed wave iv, and continuing higher in wave v to complete wave (1).
One way or another, next week will likely provide a sizeable move.