It’s Crunch Time
Clearly, when we came into this week, I was certainly not expecting to see weakness like this. So, I apologize if I did not properly prepare you for this market weakness.
You see, when we are in a bull market, more often than not the market takes the path most bullish. So, experience has taught me that during a bull market I have to side with the most reasonable and immediate bullish wave structure. Therefore, the potential for the yellow i-ii set up was quite low on my list of probabilities. The most I would have expected is a wave iv within wave 3. That is what the market is now putting to the test at this time.
So, I am going to outline the good, the bad, and the ugly, and you can then have an informed perspective about the market.
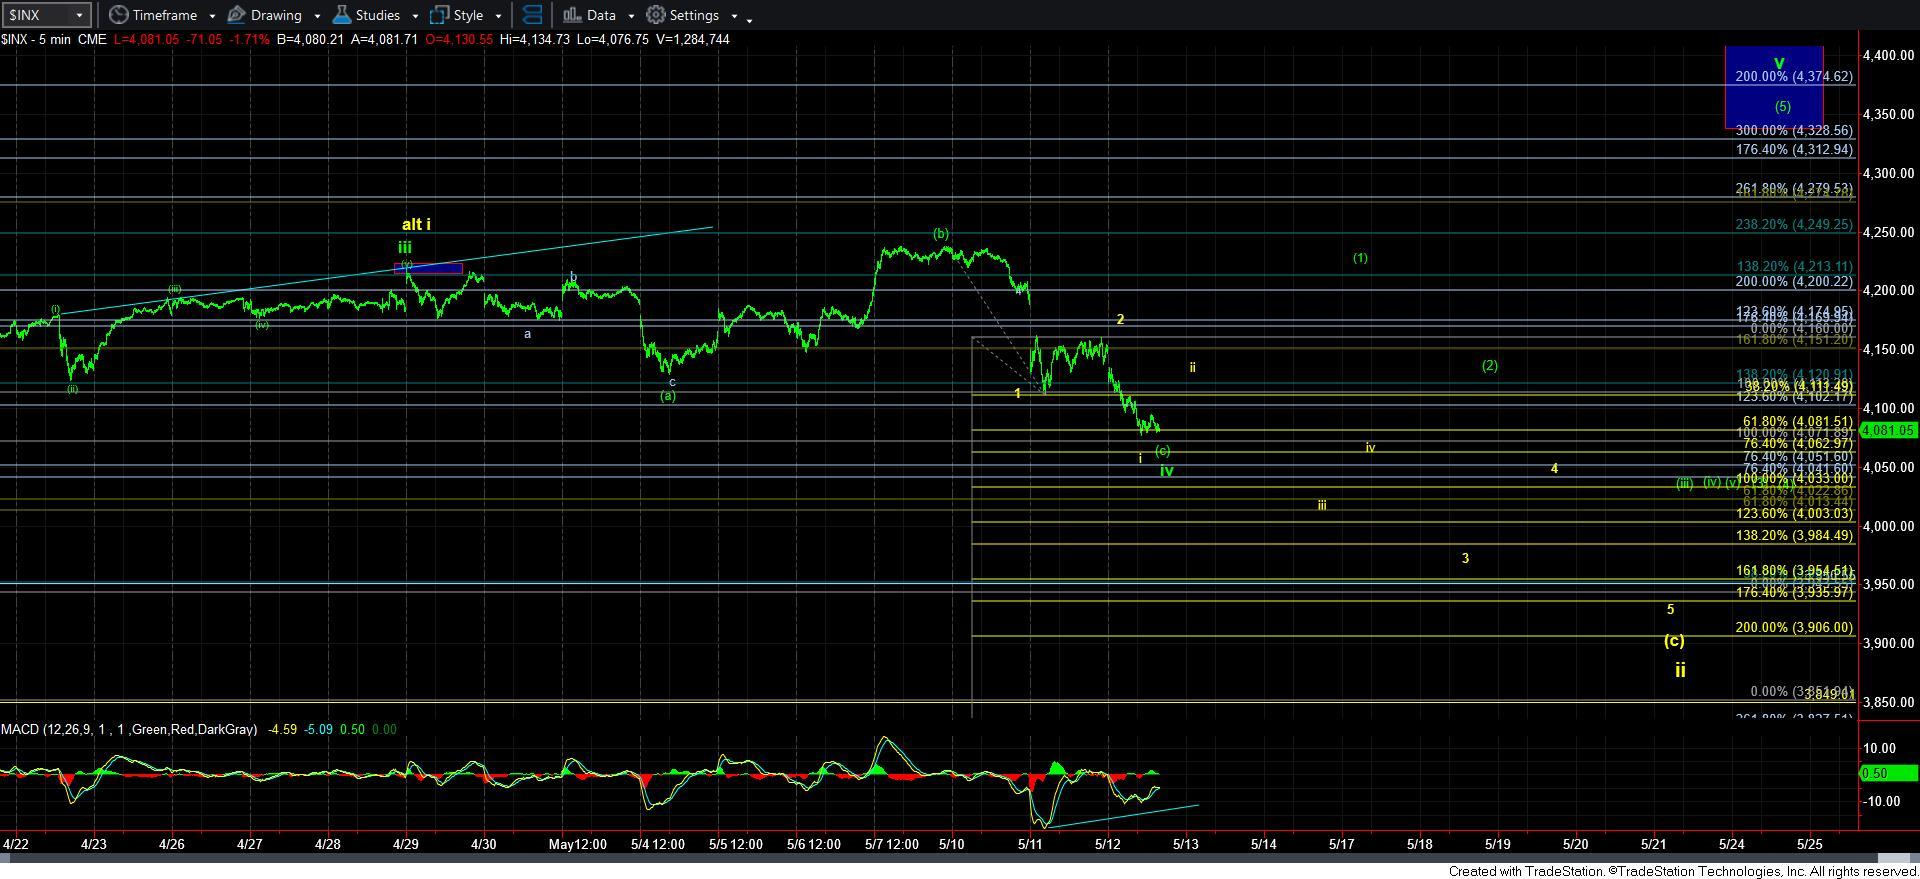
As I sent out earlier today, we can allow this wave iv to drop as deeply as the 4070-80SPX region. Clearly, this has not been my preference either, but there is a reasonable bullish interpretation for this, since the 4080 region is the .618 the size of waves 1-3, and a 5th wave is often that size. That would then be our 5th wave in the [c] wave of iv in green. Moreover, that is the general region of the .382 retracement of green wave iii.
Furthermore, the 4070SPX region is the 1.00 extension within this wave degree we are tracking, and that is a standard retracement region for a wave iv. The only problem with this is that it would then have to count on a very large wave v of 3, but that is not terribly unusual. You see, while wave iii of 3 is a strong rally wave, and wave v is often a bit weaker, wave v of 3 often travels farther than wave iii of 3. But, it means that we really should not break below 4070SPX.
The other side of the coin in dropping this low is that we have potentially set up a drop in the yellow count. Even if we get a bounce over the coming days, if that bounce is clearly corrective, then all we may be doing is setting up a i-ii downside structure within wave 3 of [c] in the yellow count. Therefore, for the bullish count to remain a strong primary count, we MUST see a clearly impulsive 5-wave structure that adheres to Fibonacci Pinball off the 4070SPX region.
Furthermore, should we see a direct break down below 4060SPX, then it becomes much more likely that we are dropping directly in wave iii of 3 in yellow, and 4080/85SPX would then be our resistance on any bounce.
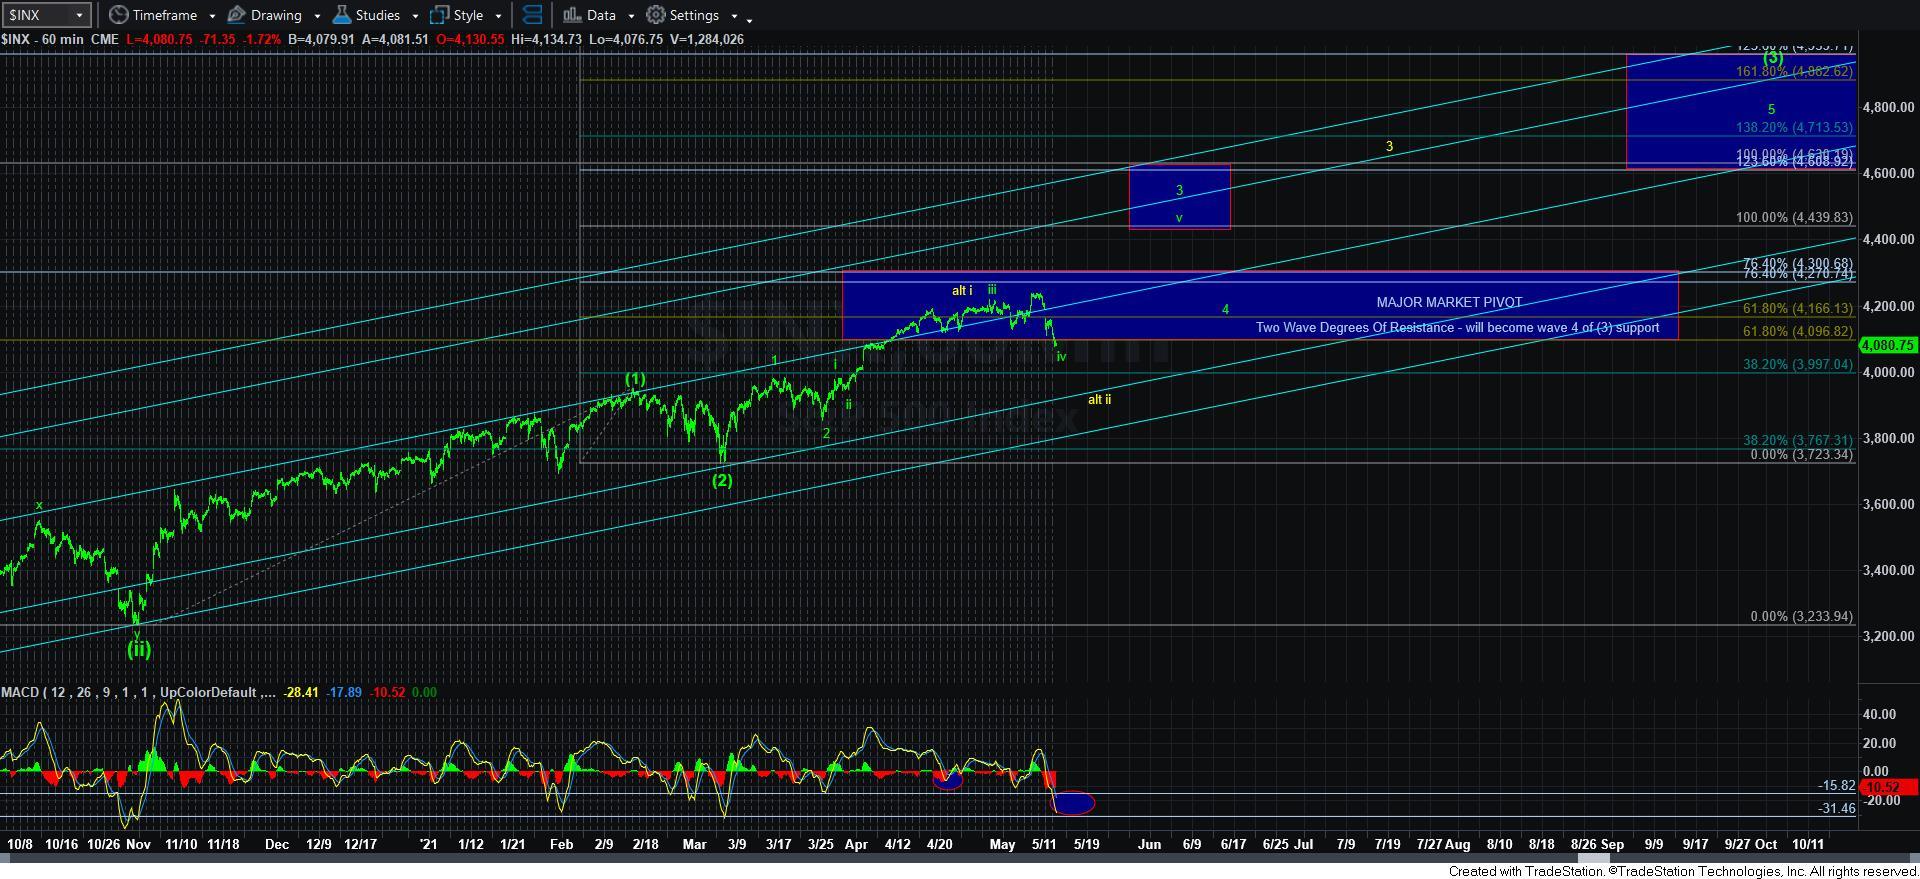
The other factors you need to consider is that the MACD on the 60-minute SPX chart is as oversold as it was for wave [2] of [iii]. In fact, you have to go back to the wave [ii] low in late October of 2020 to see a time where we have been more oversold since we began this rally in March of 2020. All other times we have been this oversold has seen 250+ point rallies not long thereafter.
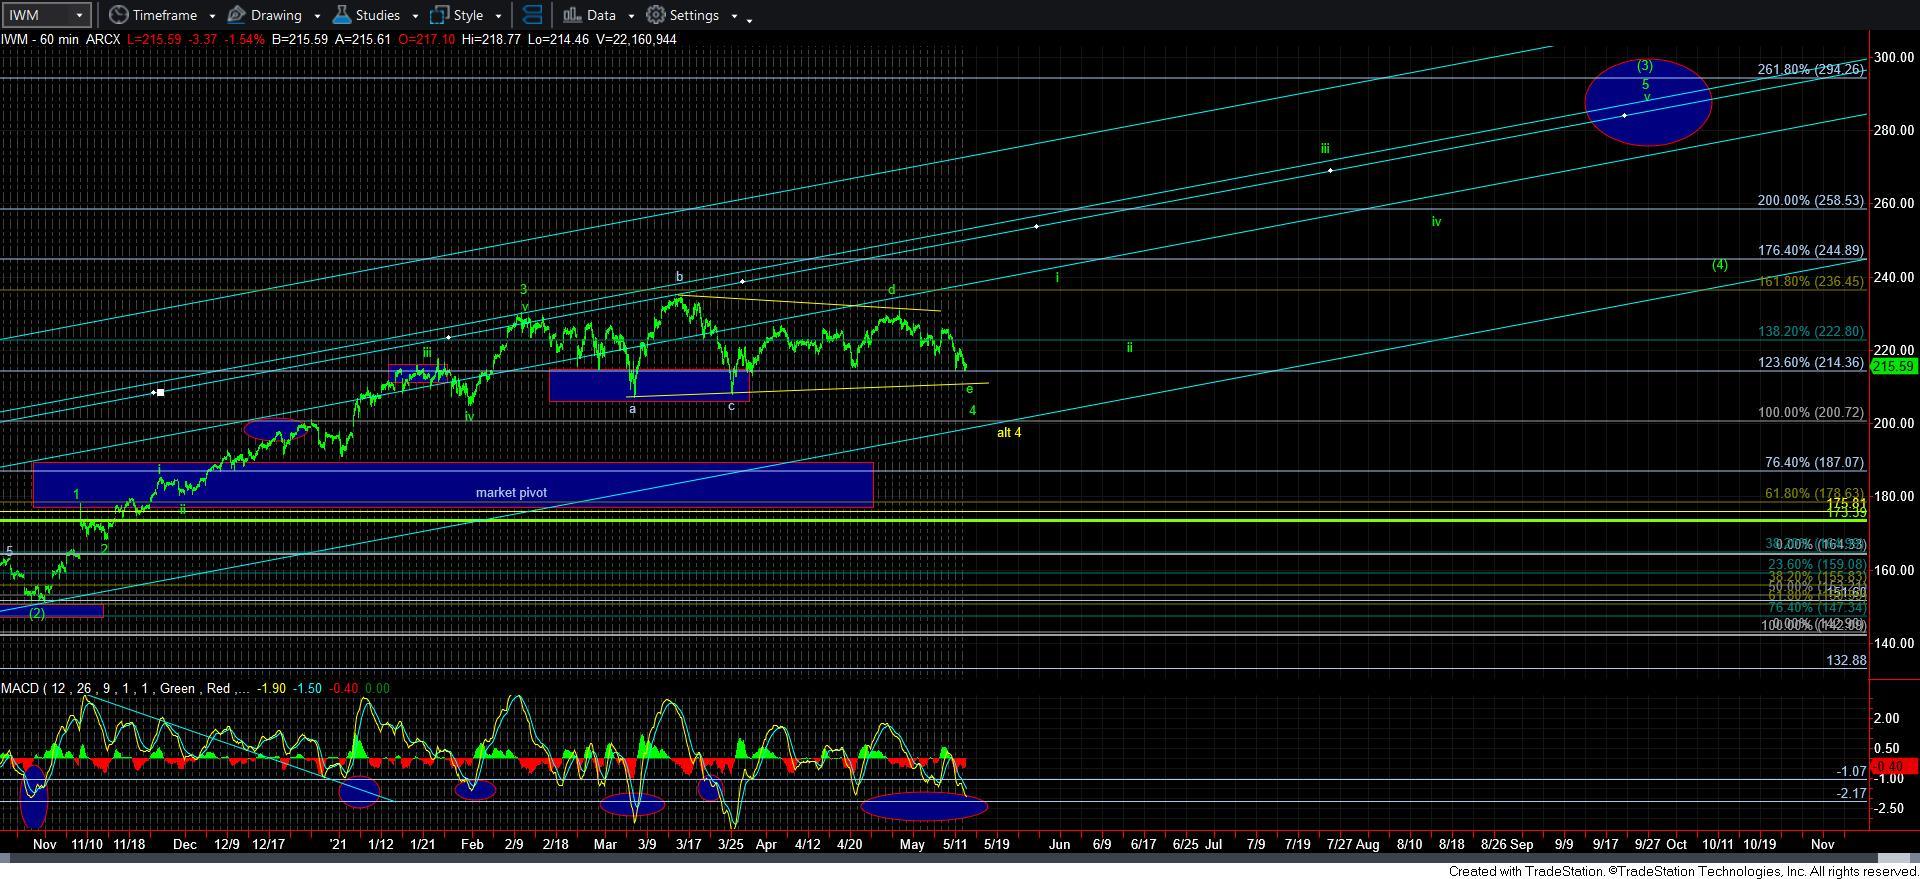
Another factor to consider is that the IWM has provided us with relative strength during this decline in the SPX. In fact, it has not broken below the low struck earlier this week, whereas the SPX is clearly below those levels.
In summary, I have to view us as being in a bull market (which we are under either scenario), and I am therefore going to adopt the most immediate bullish wave count, which is the bottoming in wave [c] of iv.
However, should we continue to break down below 4070 and follow through below 4060, then I am adopting the yellow count with a target in the 3900-3930SPX region. Furthermore, if the market is unable to provide us with an impulsive rally off this support region then I am going on high alert for a potential break down over the coming days in the yellow count. This would significantly raise the probabilities that we are developing a i-ii downside structure in the yellow count. And, it would take a break out over 4160SPX to invalidate that potential.
So, as we stand right now, we are sitting over support, and I am going to allow the market to direct us in the coming hours and days based upon the levels and analysis I just presented above.